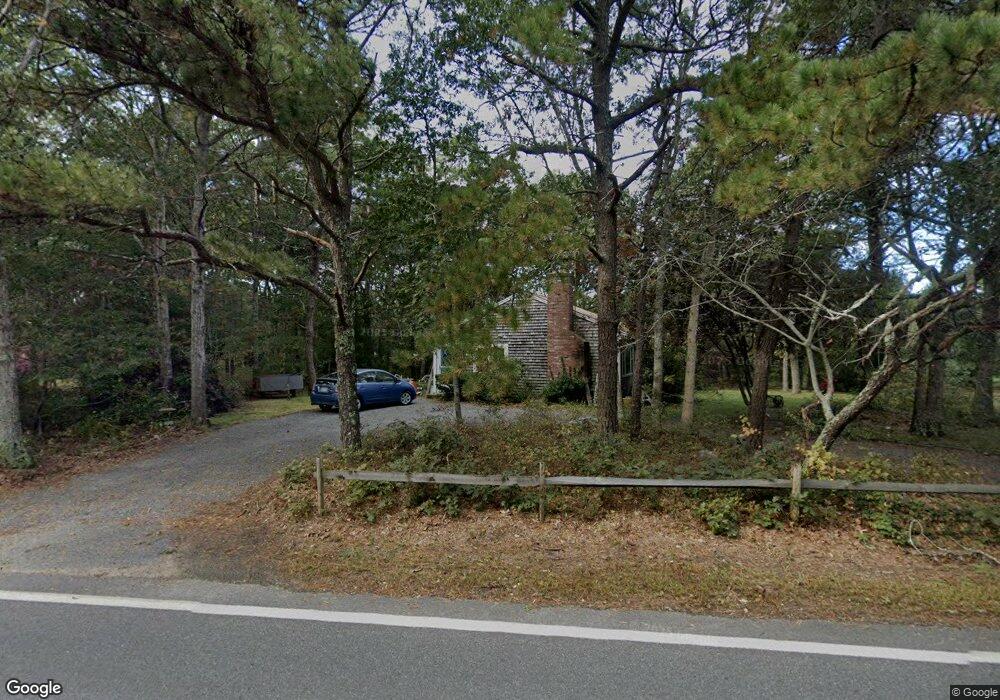
16 Wakeby Rd Marstons Mills, MA 02648
Marstons Mills NeighborhoodEstimated Value: $528,000 - $572,000
3
Beds
2
Baths
1,201
Sq Ft
$458/Sq Ft
Est. Value
About This Home
This home is located at 16 Wakeby Rd, Marstons Mills, MA 02648 and is currently estimated at $550,005, approximately $457 per square foot. 16 Wakeby Rd is a home located in Barnstable County with nearby schools including West Villages Elementary School, Barnstable United Elementary School, and Barnstable Intermediate School.
Ownership History
Date
Name
Owned For
Owner Type
Purchase Details
Closed on
Jul 9, 1999
Sold by
Manter Edwin Lewis
Bought by
Parsons Robert C
Current Estimated Value
Home Financials for this Owner
Home Financials are based on the most recent Mortgage that was taken out on this home.
Original Mortgage
$87,500
Outstanding Balance
$23,794
Interest Rate
7.19%
Mortgage Type
Purchase Money Mortgage
Estimated Equity
$526,211
Purchase Details
Closed on
Oct 14, 1994
Sold by
Pinchook William J and Pinchook Ada M
Bought by
Manter Edwin Lewis
Home Financials for this Owner
Home Financials are based on the most recent Mortgage that was taken out on this home.
Original Mortgage
$20,000
Interest Rate
8.43%
Mortgage Type
Purchase Money Mortgage
Create a Home Valuation Report for This Property
The Home Valuation Report is an in-depth analysis detailing your home's value as well as a comparison with similar homes in the area
Home Values in the Area
Average Home Value in this Area
Purchase History
| Date | Buyer | Sale Price | Title Company |
|---|---|---|---|
| Parsons Robert C | $123,200 | -- | |
| Manter Edwin Lewis | $80,000 | -- |
Source: Public Records
Mortgage History
| Date | Status | Borrower | Loan Amount |
|---|---|---|---|
| Open | Manter Edwin Lewis | $87,500 | |
| Previous Owner | Manter Edwin Lewis | $20,000 |
Source: Public Records
Tax History
| Year | Tax Paid | Tax Assessment Tax Assessment Total Assessment is a certain percentage of the fair market value that is determined by local assessors to be the total taxable value of land and additions on the property. | Land | Improvement |
|---|---|---|---|---|
| 2025 | $3,468 | $428,700 | $158,000 | $270,700 |
| 2024 | $3,330 | $426,400 | $158,000 | $268,400 |
| 2023 | $3,150 | $377,700 | $143,600 | $234,100 |
| 2022 | $2,975 | $308,600 | $106,400 | $202,200 |
| 2021 | $2,863 | $272,900 | $106,400 | $166,500 |
| 2020 | $5,978 | $267,800 | $106,400 | $161,400 |
| 2019 | $0 | $247,200 | $106,400 | $140,800 |
| 2018 | $0 | $228,900 | $112,000 | $116,900 |
| 2017 | $2,404 | $223,400 | $112,000 | $111,400 |
| 2016 | $2,443 | $224,100 | $112,700 | $111,400 |
| 2015 | $2,380 | $219,400 | $110,900 | $108,500 |
Source: Public Records
Map
Nearby Homes
- 244 Wakeby Rd
- 23 Middle Pond Path
- 348 Wakeby Rd
- 318 Old Mill Rd
- 68 Hilltop Dr
- 78 Brittany Dr
- 19 Oriole Ln
- 15 Geraldine Rd
- 192 Sandy Valley Rd
- 1415 Old Post Rd
- 65 Black Oak Rd
- 315 Blackthorn Rd
- 170 Forest Hills Rd
- 111 Reflection Dr
- 16 Newtown Rd
- 1456 Santuit-Newtown Rd
- 48 Holly Ridge Dr
- 63 Deer Ridge Rd
- 817 Race Ln
- 817 Race Ln
Your Personal Tour Guide
Ask me questions while you tour the home.