Estimated Value: $871,000 - $1,373,000
About This Home
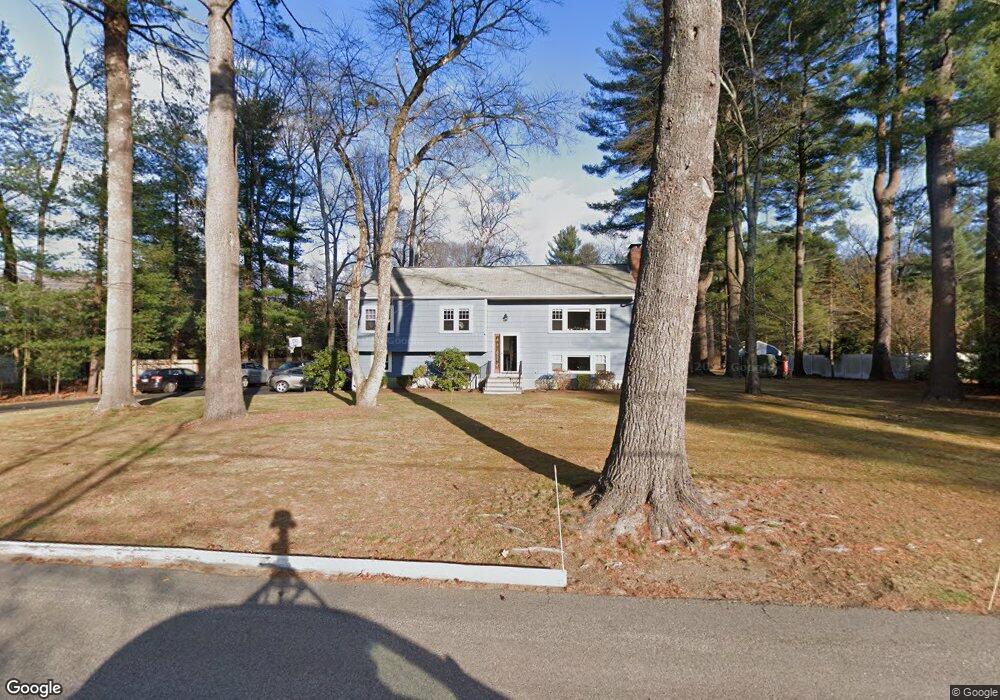
This home is located at 16 Wakeland Rd, Dover, MA 02030 and is currently estimated at $1,132,434, approximately $704 per square foot. 16 Wakeland Rd is a home located in Norfolk County with nearby schools including Chickering Elementary School, Dover-Sherborn Regional Middle School, and Dover-Sherborn Regional High School.
Ownership History
We collect this data history from publicly available records. To have your information removed, we recommend requesting removal directly through your county’s website.
Purchase Details
Home Financials for this Owner
Home Financials are based on the most recent Mortgage that was taken out on this home.Purchase Details
Home Financials for this Owner
Home Financials are based on the most recent Mortgage that was taken out on this home.Purchase Details
Home Values in the Area
Average Home Value in this Area
Purchase History
We collect this data history from publicly available records. To have your information removed, we recommend requesting removal directly through your county’s website.
| Date | Buyer | Sale Price | Title Company |
|---|---|---|---|
| $332,000 | -- | ||
| $309,000 | -- | ||
| $279,000 | -- |
Mortgage History
We collect this data history from publicly available records. To have your information removed, we recommend requesting removal directly through your county’s website.
| Date | Status | Borrower | Loan Amount |
|---|---|---|---|
| Open | $300,000 | ||
| Closed | $305,000 | ||
| Closed | $315,400 | ||
| Previous Owner | $247,000 |
Tax History
We collect this data history from publicly available records. To have your information removed, we recommend requesting removal directly through your county’s website.
| Year | Tax Paid | Tax Assessment Tax Assessment Total Assessment is a certain percentage of the fair market value that is determined by local assessors to be the total taxable value of land and additions on the property. | Land | Improvement |
|---|---|---|---|---|
| 2025 | $8,626 | $765,400 | $583,200 | $182,200 |
| 2024 | $8,268 | $754,400 | $563,600 | $190,800 |
| 2023 | $7,841 | $643,200 | $494,500 | $148,700 |
| 2022 | $7,744 | $623,500 | $474,800 | $148,700 |
| 2021 | $8,037 | $623,500 | $474,800 | $148,700 |
| 2020 | $8,006 | $623,500 | $474,800 | $148,700 |
| 2019 | $8,062 | $623,500 | $474,800 | $148,700 |
| 2018 | $7,565 | $589,200 | $474,800 | $114,400 |
| 2017 | $6,997 | $536,200 | $435,600 | $100,600 |
| 2016 | $6,906 | $536,200 | $435,600 | $100,600 |
| 2015 | $6,601 | $519,800 | $414,100 | $105,700 |
Map
- 25 Pleasant St
- 7 Circle Dr
- 3 Riverside Dr
- 68 Locust Ln
- 9 Buttercup Ln
- 8 Buttercup Ln
- 62 Claybrook Rd
- 182 Winding River Rd
- 60 Claybrook Rd
- 12 Winding River Cir
- 15 Juniper Ln
- 30 S River St
- 389 Grove St
- 18 Phillips Pond Rd
- 10 Water St
- 65 Eliot St
- 25 Longmeadow Rd
- 21 Eliot St
- 41 Longmeadow Rd
- 47 Springdale Ave
Ask me questions while you tour the home.