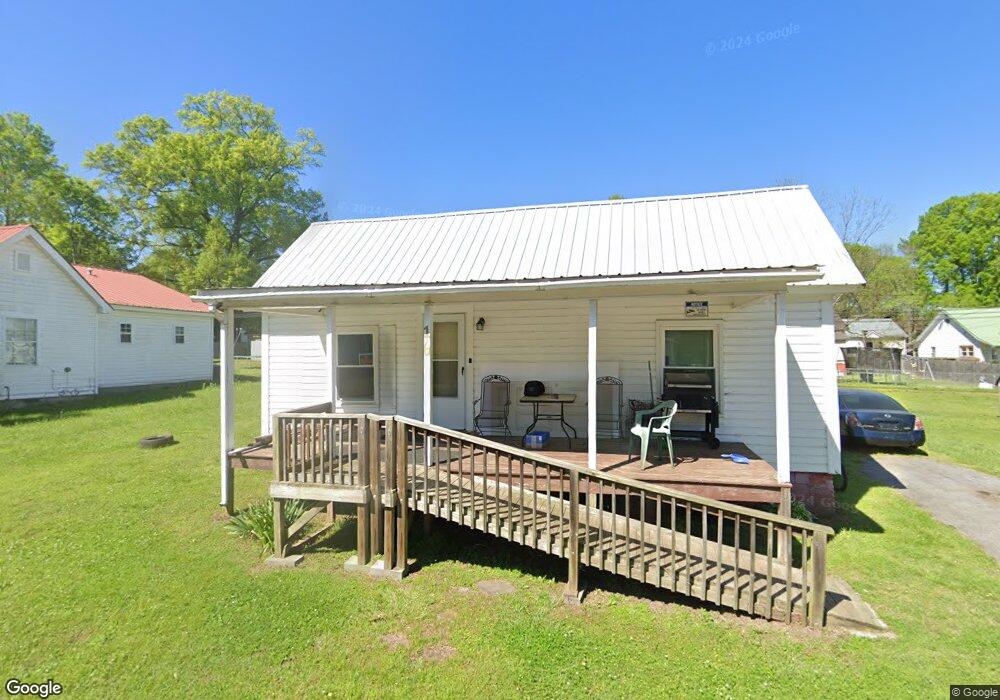
16 Walnut St Aragon, GA 30104
Estimated Value: $33,768 - $147,000
1
Bed
1
Bath
676
Sq Ft
$166/Sq Ft
Est. Value
About This Home
This home is located at 16 Walnut St, Aragon, GA 30104 and is currently estimated at $112,192, approximately $165 per square foot. 16 Walnut St is a home with nearby schools including Rockmart Middle School.
Ownership History
Date
Name
Owned For
Owner Type
Purchase Details
Closed on
Oct 17, 2016
Sold by
Betty G
Bought by
Crow Nicholas R
Current Estimated Value
Purchase Details
Closed on
Oct 5, 2016
Sold by
Betty G
Bought by
Crow Nicholas R
Purchase Details
Closed on
Jun 1, 2015
Sold by
Warren Tracey P
Bought by
Dodd Betty G
Purchase Details
Closed on
Jun 2, 1989
Sold by
Tilley Phillip R
Bought by
Warren Tracey P
Purchase Details
Closed on
Sep 2, 1988
Sold by
Scott Albert
Bought by
Tilley Phillip R
Purchase Details
Closed on
Jun 22, 1983
Sold by
Scott Mary F and Scott
Bought by
Scott Mary F and Scott
Purchase Details
Closed on
Dec 14, 1981
Sold by
Statham Franklin
Bought by
Scott Mary F and Scott
Purchase Details
Closed on
Feb 14, 1976
Sold by
Pope Ernest T
Bought by
Statham Franklin
Purchase Details
Closed on
May 18, 1974
Sold by
Statham Forsyth and Statham In
Bought by
Pope Ernest T
Purchase Details
Closed on
Apr 1, 1974
Sold by
Tant B T
Bought by
Statham Forsyth and Statham In
Purchase Details
Closed on
Sep 9, 1958
Bought by
Tant B T
Create a Home Valuation Report for This Property
The Home Valuation Report is an in-depth analysis detailing your home's value as well as a comparison with similar homes in the area
Purchase History
| Date | Buyer | Sale Price | Title Company |
|---|---|---|---|
| Crow Nicholas R | -- | -- | |
| Crow Nicholas R | $13,500 | -- | |
| Dodd Betty G | $9,500 | -- | |
| Warren Tracey P | $12,000 | -- | |
| Tilley Phillip R | $3,000 | -- | |
| Tilley Phillip R | $1,500 | -- | |
| Scott Mary F | -- | -- | |
| Scott Mary F | -- | -- | |
| Statham Franklin | -- | -- | |
| Pope Ernest T | -- | -- | |
| Statham Forsyth | -- | -- | |
| Tant B T | -- | -- |
Source: Public Records
Tax History
| Year | Tax Paid | Tax Assessment Tax Assessment Total Assessment is a certain percentage of the fair market value that is determined by local assessors to be the total taxable value of land and additions on the property. | Land | Improvement |
|---|---|---|---|---|
| 2025 | $888 | $32,637 | $8,000 | $24,637 |
| 2024 | $917 | $34,001 | $8,000 | $26,001 |
| 2023 | $400 | $14,228 | $600 | $13,628 |
| 2022 | $242 | $12,182 | $600 | $11,582 |
| 2021 | $245 | $12,182 | $600 | $11,582 |
| 2020 | $245 | $12,182 | $600 | $11,582 |
| 2019 | $147 | $7,491 | $1,438 | $6,053 |
| 2018 | $146 | $7,284 | $1,438 | $5,846 |
| 2017 | $144 | $7,284 | $1,438 | $5,846 |
| 2016 | $49 | $7,284 | $1,438 | $5,846 |
| 2015 | $131 | $4,782 | $1,438 | $3,344 |
| 2014 | $144 | $5,251 | $1,907 | $3,344 |
| 2013 | -- | $5,251 | $1,907 | $3,344 |
Source: Public Records
Map
Nearby Homes
- 19 Walnut St
- 28 Walnut St
- 30 Oak St
- 29 Elm St
- 34 Elm St
- 15 Aragon Rd
- 0 Rome Hwy 101 Unit 10445422
- 54 Taylorsville Rd
- 3 Magnolia St
- 5 Magnolia St
- 3 Magnolia Blvd
- 7 Magnolia Blvd
- 11 Magnolia St
- 65 Long Station Rd
- 1638 Prospect Rd
- 2300 Frettiesburg Dr
- 70 N Bellview Rd
- 94 Eastwood Path
- 88 N Bellview Rd
- 156 Dogwood Glen Dr
Your Personal Tour Guide
Ask me questions while you tour the home.