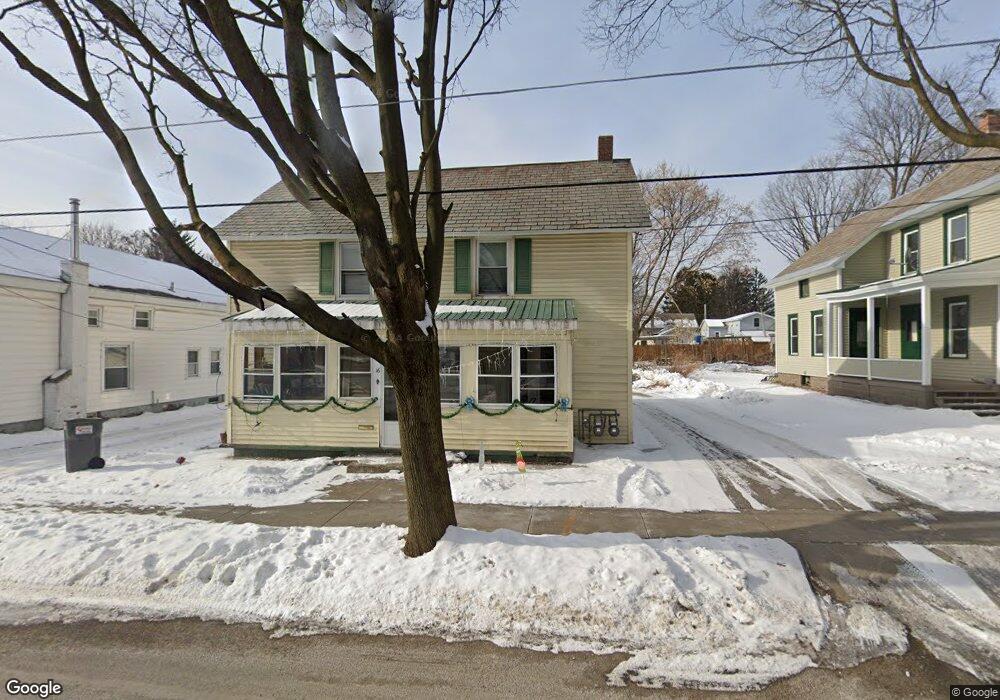
16 Walnut St Glens Falls, NY 12801
Estimated Value: $204,000 - $248,526
4
Beds
2
Baths
1,736
Sq Ft
$131/Sq Ft
Est. Value
About This Home
This home is located at 16 Walnut St, Glens Falls, NY 12801 and is currently estimated at $228,132, approximately $131 per square foot. 16 Walnut St is a home located in Warren County with nearby schools including Abraham Wing School and St. Mary's - St. Alphonsus Regional Catholic School.
Ownership History
Date
Name
Owned For
Owner Type
Purchase Details
Closed on
Jun 28, 2019
Sold by
Tnt Properties & Sales Llc
Bought by
Tnt Property Rental & Sales
Current Estimated Value
Purchase Details
Closed on
Oct 25, 2018
Sold by
Bapp Tyrone
Bought by
Tnt Properties & Sales
Purchase Details
Closed on
Feb 27, 2007
Sold by
Secretary Of Hud
Bought by
Bapp Tyrone
Purchase Details
Closed on
May 15, 2003
Sold by
Blackburn Linda A
Bought by
Roselle Christopher S
Purchase Details
Closed on
Oct 18, 2001
Sold by
Estate Saskiewicz Rita
Bought by
Blackburn Linda A
Create a Home Valuation Report for This Property
The Home Valuation Report is an in-depth analysis detailing your home's value as well as a comparison with similar homes in the area
Home Values in the Area
Average Home Value in this Area
Purchase History
| Date | Buyer | Sale Price | Title Company |
|---|---|---|---|
| Tnt Property Rental & Sales | -- | -- | |
| Tnt Properties & Sales | -- | -- | |
| Bapp Tyrone | $105,900 | -- | |
| Roselle Christopher S | $85,700 | -- | |
| Blackburn Linda A | $39,000 | Wilson A Mathias |
Source: Public Records
Tax History
| Year | Tax Paid | Tax Assessment Tax Assessment Total Assessment is a certain percentage of the fair market value that is determined by local assessors to be the total taxable value of land and additions on the property. | Land | Improvement |
|---|---|---|---|---|
| 2024 | $4,834 | $194,200 | $38,400 | $155,800 |
| 2023 | $4,501 | $176,500 | $38,400 | $138,100 |
| 2022 | $3,997 | $176,500 | $38,400 | $138,100 |
| 2021 | $3,457 | $88,800 | $15,300 | $73,500 |
| 2020 | $3,431 | $88,800 | $15,300 | $73,500 |
| 2019 | $1,639 | $88,800 | $15,300 | $73,500 |
| 2018 | $1,639 | $88,800 | $15,300 | $73,500 |
| 2017 | $1,608 | $88,800 | $15,300 | $73,500 |
| 2016 | $3,219 | $88,800 | $15,300 | $73,500 |
| 2015 | -- | $88,800 | $15,300 | $73,500 |
| 2014 | -- | $88,800 | $15,300 | $73,500 |
Source: Public Records
Map
Nearby Homes
Your Personal Tour Guide
Ask me questions while you tour the home.