
Seller's Agent in 2025
Ryan Taylor
RE/MAX
(631) 327-0327
1 in this area
14 Total Sales
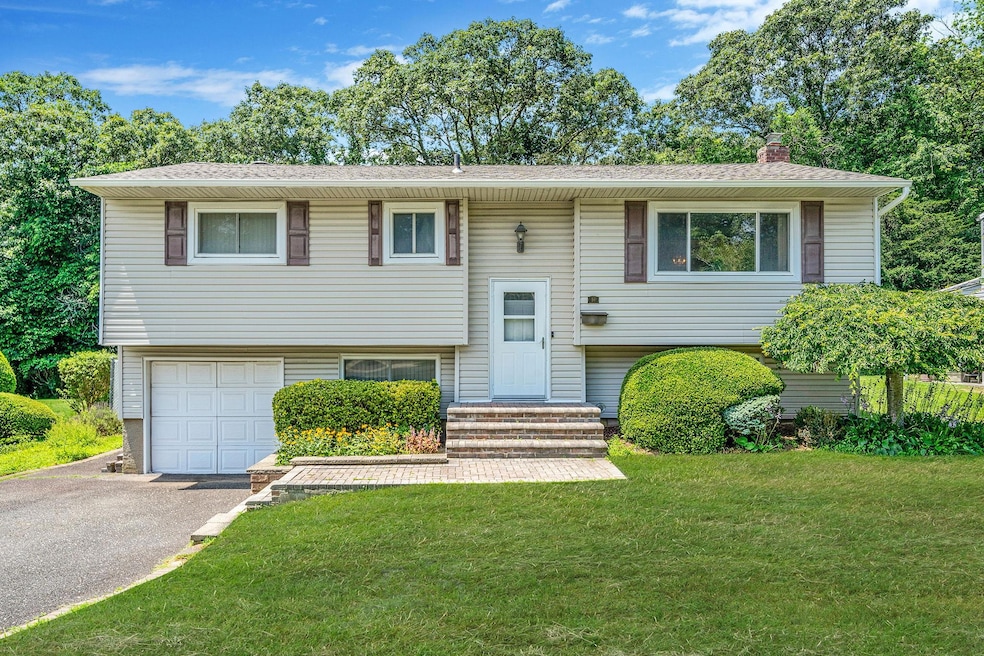
Welcome to this well-maintained home that offers a great opportunity to make it your own. Situated Mid block on a Quiet Tree Lined street with sidewalks, this home is located in the Commack School District. This 4 Bedroom, 2 Bath Hi-Ranch has a spacious Living Room and Dining Room with Hardwood floors, Kitchen with Stainless Steel Appliances with Gas cooking, Central Air, New Roof (2023), Plenty of storage on the lower level and a 1 Car Garage. Fenced in Flat backyard is great for entertaining and relaxing with an In-Ground Pool with New Pool liner (2024) and a Wooded area behind you for lots of privacy.
Last Agent to Sell the Property
RE/MAX Integrity Leaders Brokerage Phone: 631-862-1100 License #10401313696 Listed on: 07/08/2025
Co-Listed By
RE/MAX Integrity Leaders Brokerage Phone: 631-862-1100 License #30SC1065614
| Date | Type | Sale Price | Title Company |
|---|---|---|---|
| Bargain Sale Deed | $365,000 | -- | |
| Bargain Sale Deed | $365,000 | -- |
| Date | Status | Loan Amount | Loan Type |
|---|---|---|---|
| Previous Owner | $200,000 | No Value Available |
| Date | Event | Price | List to Sale | Price per Sq Ft |
|---|---|---|---|---|
| 11/18/2025 11/18/25 | Sold | $726,999 | 0.0% | $348 / Sq Ft |
| 09/08/2025 09/08/25 | Pending | -- | -- | -- |
| 08/21/2025 08/21/25 | Off Market | $726,999 | -- | -- |
| 07/08/2025 07/08/25 | For Sale | $729,999 | -- | $350 / Sq Ft |
| Year | Tax Paid | Tax Assessment Tax Assessment Total Assessment is a certain percentage of the fair market value that is determined by local assessors to be the total taxable value of land and additions on the property. | Land | Improvement |
|---|---|---|---|---|
| 2024 | $12,438 | $5,000 | $335 | $4,665 |
| 2023 | $12,438 | $5,000 | $335 | $4,665 |
| 2022 | $11,208 | $5,000 | $335 | $4,665 |
| 2021 | $11,208 | $5,000 | $335 | $4,665 |
| 2020 | $11,685 | $5,000 | $335 | $4,665 |
| 2019 | $11,685 | $0 | $0 | $0 |
| 2018 | -- | $5,000 | $335 | $4,665 |
| 2017 | $10,693 | $5,000 | $335 | $4,665 |
| 2016 | $11,030 | $5,000 | $335 | $4,665 |
| 2015 | -- | $5,000 | $335 | $4,665 |
| 2014 | -- | $5,000 | $335 | $4,665 |
Seller's Agent in 2025
Ryan Taylor
RE/MAX
(631) 327-0327
1 in this area
14 Total Sales
Seller Co-Listing Agent in 2025
Michael Scarito
RE/MAX
(631) 338-5018
16 in this area
131 Total Sales
Buyer's Agent in 2025
Kristin Scanlon
Keller Williams Rty Gold Coast
(646) 599-5649
3 in this area
114 Total Sales
P
Buyer Co-Listing Agent in 2025
Paige Johnson
Keller Williams Rty Gold Coast
(516) 482-0200
2 in this area
7 Total Sales
Source: OneKey® MLS
MLS Number: 885906
APN: 0800-066-00-05-00-029-000
Disclaimer: Certain information contained herein is derived from information provided by parties other than Homes.com. All information provided is deemed reliable, but is not guaranteed to be accurate and should be independently verified.
![]() The data relating to real estate for sale or lease on this web site comes in part from OneKey® MLS. Real estate listings held by brokerage firms other than Ten-X are marked with the OneKey® MLS logo or an abbreviated logo and detailed information about them includes the name of the listing broker.
The data relating to real estate for sale or lease on this web site comes in part from OneKey® MLS. Real estate listings held by brokerage firms other than Ten-X are marked with the OneKey® MLS logo or an abbreviated logo and detailed information about them includes the name of the listing broker.
IDX information is provided exclusively for personal, non-commercial use, and may not be used for any purpose other than to identify prospective properties consumers may be interested in purchasing.
Information is deemed reliable but not guaranteed.
Copyright 2025 OneKey® MLS. All rights reserved.