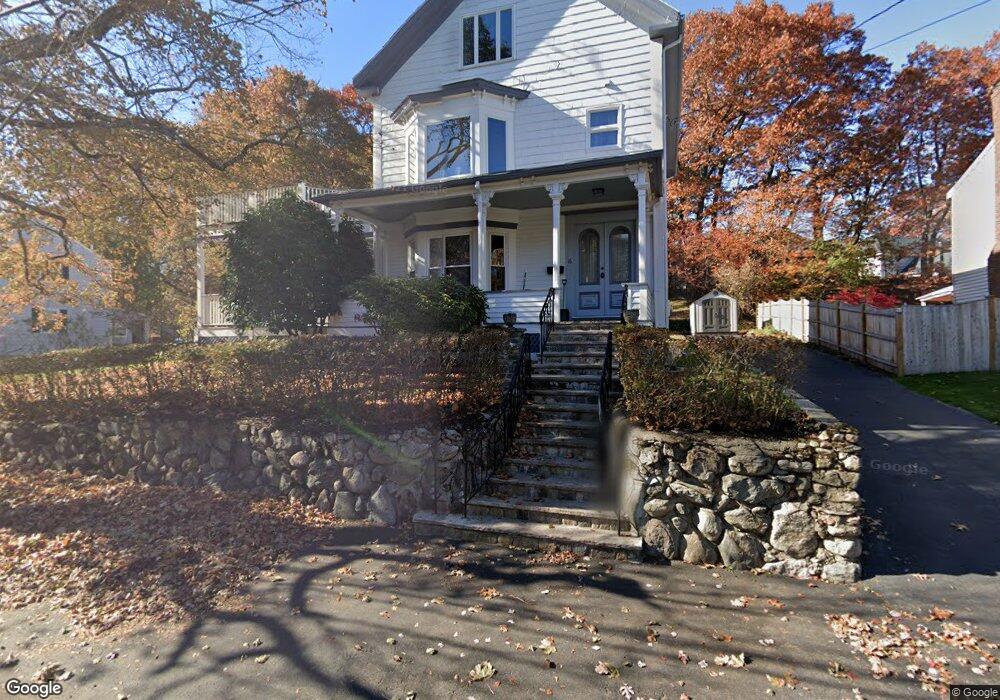
16 West St Stoneham, MA 02180
Lindenwood NeighborhoodEstimated Value: $836,000 - $987,915
4
Beds
4
Baths
2,616
Sq Ft
$340/Sq Ft
Est. Value
About This Home
This home is located at 16 West St, Stoneham, MA 02180 and is currently estimated at $889,479, approximately $340 per square foot. 16 West St is a home located in Middlesex County with nearby schools including Stoneham High School, St. Patrick Elementary School, and Greater Boston Academy.
Ownership History
Date
Name
Owned For
Owner Type
Purchase Details
Closed on
Feb 15, 2025
Sold by
Caruso Salvatore and Caruso Rosanna
Bought by
Salvatore Caruso Irt and Caruso
Current Estimated Value
Purchase Details
Closed on
Sep 5, 1975
Bought by
Caruso Salvatore and Caruso Rosanna
Create a Home Valuation Report for This Property
The Home Valuation Report is an in-depth analysis detailing your home's value as well as a comparison with similar homes in the area
Home Values in the Area
Average Home Value in this Area
Purchase History
| Date | Buyer | Sale Price | Title Company |
|---|---|---|---|
| Salvatore Caruso Irt | -- | None Available | |
| Salvatore Caruso Irt | -- | None Available | |
| Caruso Salvatore | -- | -- |
Source: Public Records
Mortgage History
| Date | Status | Borrower | Loan Amount |
|---|---|---|---|
| Previous Owner | Caruso Salvatore | $50,000 | |
| Previous Owner | Caruso Salvatore | $159,750 | |
| Previous Owner | Caruso Salvatore | $120,000 | |
| Previous Owner | Caruso Salvatore | $350,000 |
Source: Public Records
Tax History
| Year | Tax Paid | Tax Assessment Tax Assessment Total Assessment is a certain percentage of the fair market value that is determined by local assessors to be the total taxable value of land and additions on the property. | Land | Improvement |
|---|---|---|---|---|
| 2025 | $8,824 | $862,600 | $421,900 | $440,700 |
| 2024 | $8,923 | $842,600 | $401,900 | $440,700 |
| 2023 | $8,708 | $784,500 | $361,900 | $422,600 |
| 2022 | $7,760 | $745,400 | $331,900 | $413,500 |
| 2021 | $7,849 | $725,400 | $311,900 | $413,500 |
| 2020 | $7,513 | $696,300 | $311,900 | $384,400 |
| 2019 | $7,404 | $659,900 | $281,900 | $378,000 |
| 2018 | $7,497 | $640,200 | $251,900 | $388,300 |
| 2017 | $7,461 | $602,200 | $251,900 | $350,300 |
| 2016 | $7,106 | $559,500 | $241,900 | $317,600 |
| 2015 | $6,637 | $512,100 | $211,900 | $300,200 |
| 2014 | $6,284 | $465,800 | $201,900 | $263,900 |
Source: Public Records
Map
Nearby Homes
- 1 Alden Ave
- 200 Ledgewood Dr Unit 601
- 10 Pomeworth St Unit A
- 1 Tremont St
- 8 Common St Unit 3
- 159 Main St Unit 27C
- 159 Main St Unit 39A
- 21 Tremont St Unit B
- 21 Tremont St Unit A
- 10 Rodgers Rd
- 35 Tremont St
- 58 Washington St
- 57 Park St
- 8 Steele St
- 4 Garfield Ave
- 98 Main St Unit 2
- 6 Stratton Dr Unit 307
- 6 Stratton Dr Unit 208
- 6 Stratton Dr Unit 303
- 6 Everett St
Your Personal Tour Guide
Ask me questions while you tour the home.