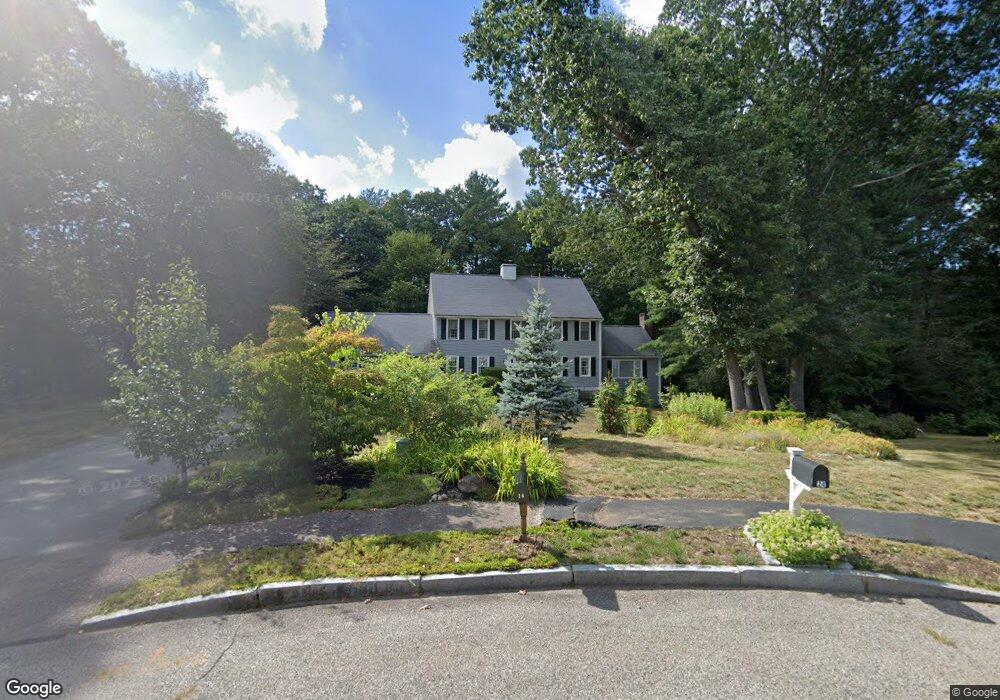
16 Winstanley Way Hanover, MA 02339
Estimated Value: $1,034,000 - $1,478,000
4
Beds
3
Baths
2,760
Sq Ft
$439/Sq Ft
Est. Value
About This Home
This home is located at 16 Winstanley Way, Hanover, MA 02339 and is currently estimated at $1,211,333, approximately $438 per square foot. 16 Winstanley Way is a home located in Plymouth County with nearby schools including Hanover High School, Calvary Chapel Academy, and Holy Family Elementary School.
Ownership History
Date
Name
Owned For
Owner Type
Purchase Details
Closed on
Jul 22, 1996
Sold by
Chs Homes Inc
Bought by
Oteri David A and Oteri Kathleen M
Current Estimated Value
Home Financials for this Owner
Home Financials are based on the most recent Mortgage that was taken out on this home.
Original Mortgage
$270,000
Interest Rate
8.28%
Mortgage Type
Purchase Money Mortgage
Create a Home Valuation Report for This Property
The Home Valuation Report is an in-depth analysis detailing your home's value as well as a comparison with similar homes in the area
Home Values in the Area
Average Home Value in this Area
Purchase History
| Date | Buyer | Sale Price | Title Company |
|---|---|---|---|
| Oteri David A | $339,000 | -- |
Source: Public Records
Mortgage History
| Date | Status | Borrower | Loan Amount |
|---|---|---|---|
| Open | Oteri David A | $230,800 | |
| Open | Oteri David A | $360,000 | |
| Closed | Oteri David A | $357,600 | |
| Closed | Oteri David A | $270,000 |
Source: Public Records
Tax History
| Year | Tax Paid | Tax Assessment Tax Assessment Total Assessment is a certain percentage of the fair market value that is determined by local assessors to be the total taxable value of land and additions on the property. | Land | Improvement |
|---|---|---|---|---|
| 2025 | $11,920 | $965,200 | $350,500 | $614,700 |
| 2024 | $11,623 | $905,200 | $350,500 | $554,700 |
| 2023 | $11,198 | $830,100 | $318,900 | $511,200 |
| 2022 | $11,165 | $732,100 | $280,700 | $451,400 |
| 2021 | $11,142 | $682,300 | $255,300 | $427,000 |
| 2020 | $10,817 | $663,200 | $255,300 | $407,900 |
| 2019 | $10,824 | $659,600 | $278,500 | $381,100 |
| 2018 | $10,116 | $621,400 | $278,500 | $342,900 |
| 2017 | $10,117 | $612,400 | $278,500 | $333,900 |
| 2016 | $9,770 | $579,500 | $253,200 | $326,300 |
| 2015 | $9,359 | $579,500 | $253,200 | $326,300 |
Source: Public Records
Map
Nearby Homes
- 36 Bayberry Ln
- 47 Stone Meadow Ln
- 44 Stone Meadow Ln
- 46 Brookwood Rd
- 535 Webster St
- 776 Main St
- 18 Winterberry Ln
- 738 Whiting St
- 26 Hobart Ln Unit 26,C
- 206-208 Hinghm St
- 303 Pond St
- 506 Main St
- 5 Blueberry Ct
- 8 Blueberry Ct
- 1 Von Rhor Dr Unit 1
- 49 Washington Park Dr
- 55 Turner Rd
- 53 Chestnut St
- 18 Colby St
- 823 Market St
- 202 Ledgewood Dr
- 24 Winstanley Way
- 214 Ledgewood Dr
- 135 Great Rock Rd
- 188 Ledgewood Dr
- 19 Winstanley Way
- 125 Great Rock Rd
- 232 Ledgewood Dr
- 211 Ledgewood Dr
- 197 Ledgewood Dr
- 176 Ledgewood Dr
- 225 Ledgewood Dr
- 11 Shingle Mill Ln
- 111 Great Rock Rd
- 185 Ledgewood Dr
- 246 Ledgewood Dr
- 235 Ledgewood Dr
- 122 Great Rock Rd
- 164 Ledgewood Dr
- 59 Shingle Mill Ln
Your Personal Tour Guide
Ask me questions while you tour the home.