S
Landlord's Agent in 2016
Steve Foley
Foley & Soule Associates
1 Total Sale
Estimated Value: $1,207,000 - $1,414,000
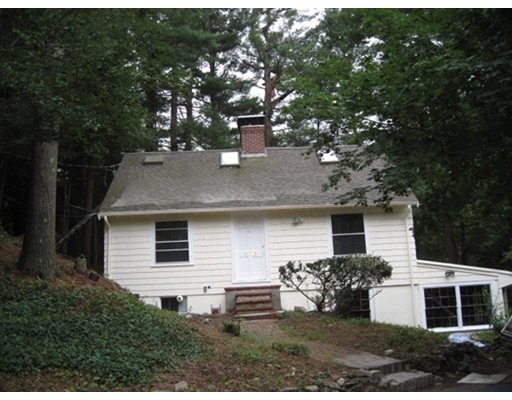
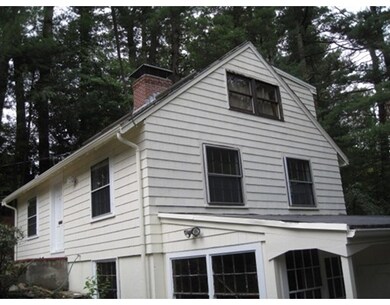
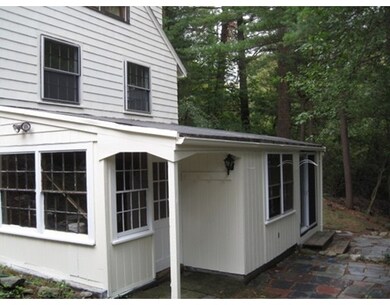
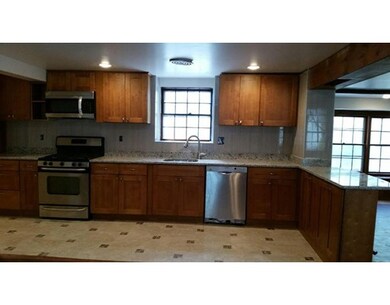
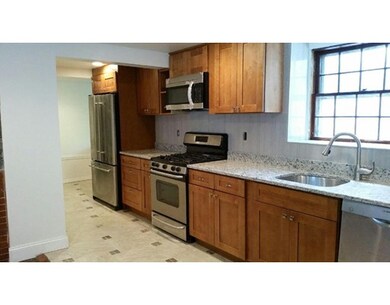
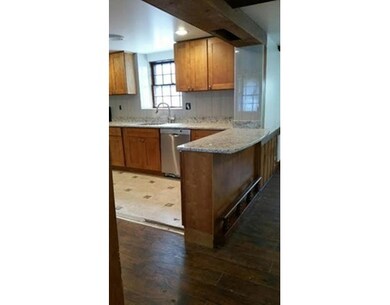
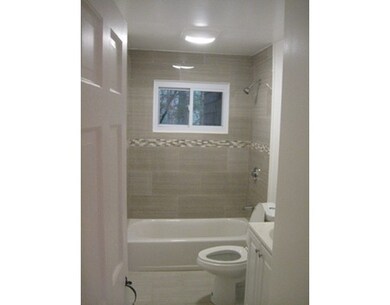
Located on almost one acre of land, this site provides a great deal of privacy. This is not your ordinary cape style dwelling. Extensive stonework around the house perfect for recreation, entertainment, or relaxation. Lots of storage in the lower level of the adjacent barn. Lower level kitchen, family room, and bonus room with working fireplace. New Kitchen. This is a great opportunity to live in Weston, in a newly renovated single family home.
Home Type
Other
Est. Annual Taxes
$10,702
Year Built
1949
Lot Details
0
| Date | Buyer | Sale Price | Title Company |
|---|---|---|---|
| David K Hofert Ret | -- | -- | |
| Hofert David K | $750,000 | -- | |
| Williams Gethin | -- | -- | |
| Williams Gethin | $725,000 | -- | |
| Williams Gethin | $725,000 | -- |
| Date | Status | Borrower | Loan Amount |
|---|---|---|---|
| Previous Owner | Hofert David K | $525,000 | |
| Previous Owner | Williams Gethin | $580,000 |
| Date | Event | Price | List to Sale | Price per Sq Ft |
|---|---|---|---|---|
| 09/27/2016 09/27/16 | Rented | $2,950 | 0.0% | -- |
| 08/25/2016 08/25/16 | Price Changed | $2,950 | -7.8% | $1 / Sq Ft |
| 08/04/2016 08/04/16 | Price Changed | $3,200 | -3.0% | $1 / Sq Ft |
| 06/28/2016 06/28/16 | For Rent | $3,300 | 0.0% | -- |
| 04/15/2016 04/15/16 | Off Market | $3,300 | -- | -- |
| 12/17/2015 12/17/15 | For Rent | $3,300 | 0.0% | -- |
| 02/27/2015 02/27/15 | Rented | $3,300 | -5.7% | -- |
| 01/28/2015 01/28/15 | Under Contract | -- | -- | -- |
| 07/07/2014 07/07/14 | For Rent | $3,500 | +45.8% | -- |
| 11/16/2012 11/16/12 | Rented | $2,400 | -17.2% | -- |
| 10/17/2012 10/17/12 | Under Contract | -- | -- | -- |
| 07/31/2012 07/31/12 | For Rent | $2,900 | -- | -- |
| Year | Tax Paid | Tax Assessment Tax Assessment Total Assessment is a certain percentage of the fair market value that is determined by local assessors to be the total taxable value of land and additions on the property. | Land | Improvement |
|---|---|---|---|---|
| 2025 | $10,702 | $964,100 | $754,600 | $209,500 |
| 2024 | $10,613 | $954,400 | $754,600 | $199,800 |
| 2023 | $10,879 | $918,800 | $754,600 | $164,200 |
| 2022 | $10,819 | $844,600 | $712,800 | $131,800 |
| 2021 | $7,543 | $801,800 | $675,600 | $126,200 |
| 2020 | $10,287 | $801,800 | $675,600 | $126,200 |
| 2019 | $9,476 | $752,700 | $631,700 | $121,000 |
| 2018 | $9,416 | $752,700 | $631,700 | $121,000 |
| 2017 | $9,333 | $752,700 | $631,700 | $121,000 |
| 2016 | $9,153 | $752,700 | $631,700 | $121,000 |
| 2015 | $8,834 | $719,400 | $601,700 | $117,700 |
S
Landlord's Agent in 2016
Steve Foley
Foley & Soule Associates
1 Total Sale

Tenant's Agent in 2016
Derek Soule
Foley & Soule Associates
(508) 361-1132
3 Total Sales
Source: MLS Property Information Network (MLS PIN)
MLS Number: 71942417
APN: WEST-000012-000156
Disclaimer: Certain information contained herein is derived from information provided by parties other than Homes.com. All information provided is deemed reliable, but is not guaranteed to be accurate and should be independently verified.
![]() The property listing data and information, or the Images, set forth herein were provided to MLS Property Information Network, Inc. from third party sources, including sellers, lessors and public records, and were compiled by MLS Property Information Network, Inc. The property listing data and information, and the Images, are for the personal, non-commercial use of consumers having a good faith interest in purchasing or leasing listed properties of the type displayed to them and may not be used for any purpose other than to identify prospective properties which such consumers may have a good faith interest in purchasing or leasing. MLS Property Information Network, Inc. and its subscribers disclaim any and all representations and warranties as to the accuracy of the property listing data and information, or as to the accuracy of any of the Images, set forth herein.
The property listing data and information, or the Images, set forth herein were provided to MLS Property Information Network, Inc. from third party sources, including sellers, lessors and public records, and were compiled by MLS Property Information Network, Inc. The property listing data and information, and the Images, are for the personal, non-commercial use of consumers having a good faith interest in purchasing or leasing listed properties of the type displayed to them and may not be used for any purpose other than to identify prospective properties which such consumers may have a good faith interest in purchasing or leasing. MLS Property Information Network, Inc. and its subscribers disclaim any and all representations and warranties as to the accuracy of the property listing data and information, or as to the accuracy of any of the Images, set forth herein.