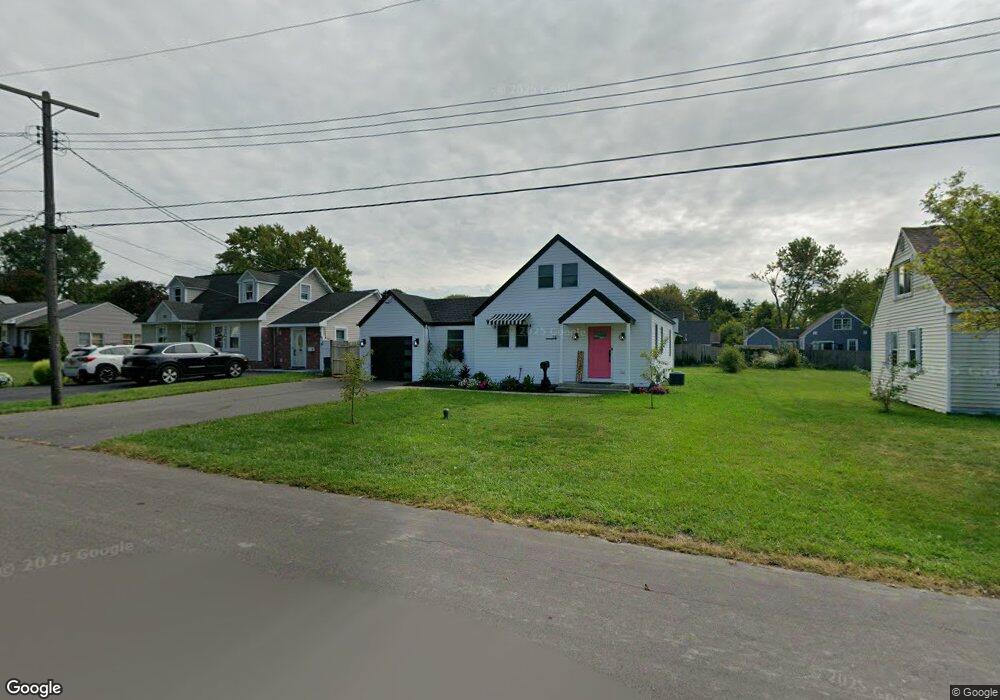
16 Wyncrest Dr East Syracuse, NY 13057
Estimated Value: $181,000 - $204,000
3
Beds
1
Bath
1,188
Sq Ft
$162/Sq Ft
Est. Value
About This Home
This home is located at 16 Wyncrest Dr, East Syracuse, NY 13057 and is currently estimated at $192,543, approximately $162 per square foot. 16 Wyncrest Dr is a home located in Onondaga County with nearby schools including Woodland Elementary School, Pine Grove Middle School, and East Syracuse Minoa Central High School.
Ownership History
Date
Name
Owned For
Owner Type
Purchase Details
Closed on
Apr 7, 2025
Sold by
Street Angelique M and Street Laura J
Bought by
Maison De Rue Llc
Current Estimated Value
Purchase Details
Closed on
May 11, 2022
Sold by
Carroll David T
Bought by
Street Laura J and Street Angelique M
Purchase Details
Closed on
Mar 31, 2011
Sold by
Fielding Jeffrey
Bought by
Fielding Jeffrey
Purchase Details
Closed on
Nov 8, 2006
Sold by
Fielding Jeffrey
Bought by
Fielding Jeffrey
Purchase Details
Closed on
Oct 4, 2000
Sold by
Turan Lisa S
Bought by
Fielding Jeffrey J
Purchase Details
Closed on
Jul 31, 1996
Sold by
Onondaga County Housing Develo
Bought by
Wigler Christopher G and Wigler Kristin
Purchase Details
Closed on
Mar 7, 1996
Purchase Details
Closed on
Oct 23, 1995
Create a Home Valuation Report for This Property
The Home Valuation Report is an in-depth analysis detailing your home's value as well as a comparison with similar homes in the area
Home Values in the Area
Average Home Value in this Area
Purchase History
| Date | Buyer | Sale Price | Title Company |
|---|---|---|---|
| Maison De Rue Llc | -- | None Available | |
| Street Laura J | $90,000 | None Available | |
| Fielding Jeffrey | -- | Mark Wasmund | |
| Fielding Jeffrey | -- | Mark Wasmund | |
| Fielding Jeffrey | -- | -- | |
| Fielding Jeffrey | -- | -- | |
| Fielding Jeffrey J | $60,000 | Margaret M. Robinson | |
| Fielding Jeffrey J | $60,000 | Margaret M. Robinson | |
| Wigler Christopher G | $71,000 | -- | |
| Wigler Christopher G | $71,000 | -- | |
| -- | $45,000 | -- | |
| -- | $45,000 | -- | |
| -- | $68,300 | -- | |
| -- | $68,300 | -- |
Source: Public Records
Tax History Compared to Growth
Tax History
| Year | Tax Paid | Tax Assessment Tax Assessment Total Assessment is a certain percentage of the fair market value that is determined by local assessors to be the total taxable value of land and additions on the property. | Land | Improvement |
|---|---|---|---|---|
| 2024 | $4,339 | $137,500 | $12,750 | $124,750 |
| 2023 | $3,768 | $101,900 | $12,750 | $89,150 |
| 2022 | $2,350 | $53,500 | $12,750 | $40,750 |
| 2021 | $2,213 | $44,600 | $12,750 | $31,850 |
| 2020 | $2,212 | $41,300 | $12,750 | $28,550 |
| 2019 | $1,488 | $41,300 | $12,750 | $28,550 |
| 2018 | $2,491 | $39,000 | $12,750 | $26,250 |
| 2017 | $4,699 | $72,900 | $13,800 | $59,100 |
| 2016 | $5,855 | $72,900 | $13,800 | $59,100 |
| 2015 | -- | $68,800 | $13,800 | $55,000 |
| 2014 | -- | $68,800 | $13,800 | $55,000 |
Source: Public Records
Map
Nearby Homes