NOT LISTED FOR SALE

16 Yale St Uxbridge, MA 01569

Estimated Value: $390,000 - $442,000

4 Beds
2 Baths
1,836 Sq Ft
$225/Sq Ft Est. Value

Last Sold July 31, 2023

Last sale price $360,000 $196 Per Sq Ft

Est. 15% increase in value since last sale

Current estimated payment $2,170/month

About This Home

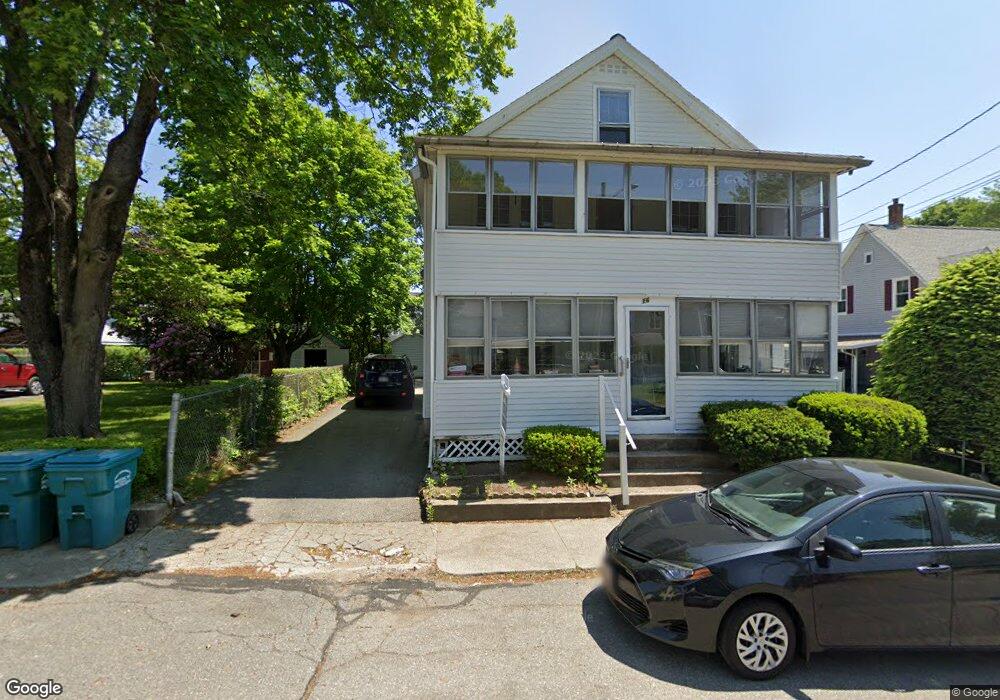
This home is located at 16 Yale St, Uxbridge, MA 01569 and is currently estimated at $413,034, approximately $224 per square foot. 16 Yale St is a home located in Worcester County with nearby schools including Uxbridge High School, Whitinsville Christian School, and Our Lady of the Valley Regional School.

Range of Values:

--
Value Increase
--
Percent Increase
--
Adjusted for Inflation
Collateral Analytics

Collateral Analytics Collateral Analytics AVMs (Automated Valuation Model) employ a number of statistical approaches combined with neighborhood-specific comparable selection guarantees the most up-to-date and precise valuations.

Not Available

Collateral Analytics does not have data for the current month. Please view the chart for historical values.

ICE

ICE Mortgage Technology ICE Mortgage Technology’s AVM (Automated Valuation Model) is a state-of-the-art online residential property valuation tool that provides a quick and accurate estimate of the value of almost any home in the U.S.

Not Available

ICE Mortgage Technology does not have data for the current month. Please view the chart for historical values.

First American

First American First American Data & Analytics’ next-generation AVM combines unrivaled data assets with a blended ensemble of valuation models to produce highly accurate, reliable valuations you can trust.

Not Available

First American does not have data for the current month. Please view the chart for historical values.

Quantarium

Quantarium Quantarium’s valuation service, repeatedly proven the industry’s most accurate and comprehensive, is supercharged with a self-learning and auto-tuning AI engine that continually becomes smarter and more accurate as it processes daily inputs from the industry’s leading RE data lake.

Not Available

Quantarium does not have data for the current month. Please view the chart for historical values.

Average Value
Not Available
List Price
Sold Price
Create a Home Valuation Report for This Property
The Home Valuation Report is an in-depth analysis detailing your home's value as well as a comparison with similar homes in the area

Home Values in the Area

Source: Public Records

Average Home Value in this Area


Source: Public Records

Property History

Date Event Price List to Sale Price per Sq Ft Prior Sale
07/31/2023 07/31/23 Sold $360,000 +9.1% $196 / Sq Ft View Prior Sale
04/23/2023 04/23/23 Pending -- -- --
04/19/2023 04/19/23 For Sale $329,900 -- $180 / Sq Ft

Tax History Compared to Growth

Source: Public Records

Tax History

Year Tax Paid Tax Assessment Tax Assessment Total Assessment is a certain percentage of the fair market value that is determined by local assessors to be the total taxable value of land and additions on the property. Land Improvement
2025 $41 $313,300 $87,800 $225,500
2024 $4,004 $309,900 $83,300 $226,600
2023 $3,739 $268,000 $72,000 $196,000
2022 $3,491 $230,300 $63,000 $167,300
2021 $3,428 $216,700 $61,700 $155,000
2020 $3,445 $205,800 $60,800 $145,000
2019 $3,441 $198,300 $60,800 $137,500
2018 $3,092 $180,100 $60,800 $119,300
2017 $3,299 $194,500 $79,900 $114,600
2016 $3,001 $170,800 $60,500 $110,300
2015 $2,904 $166,900 $60,500 $106,400
Source: Public Records

Agents Affiliated with this Home

  • Section Image
  • Section Image
See All Agents

Map