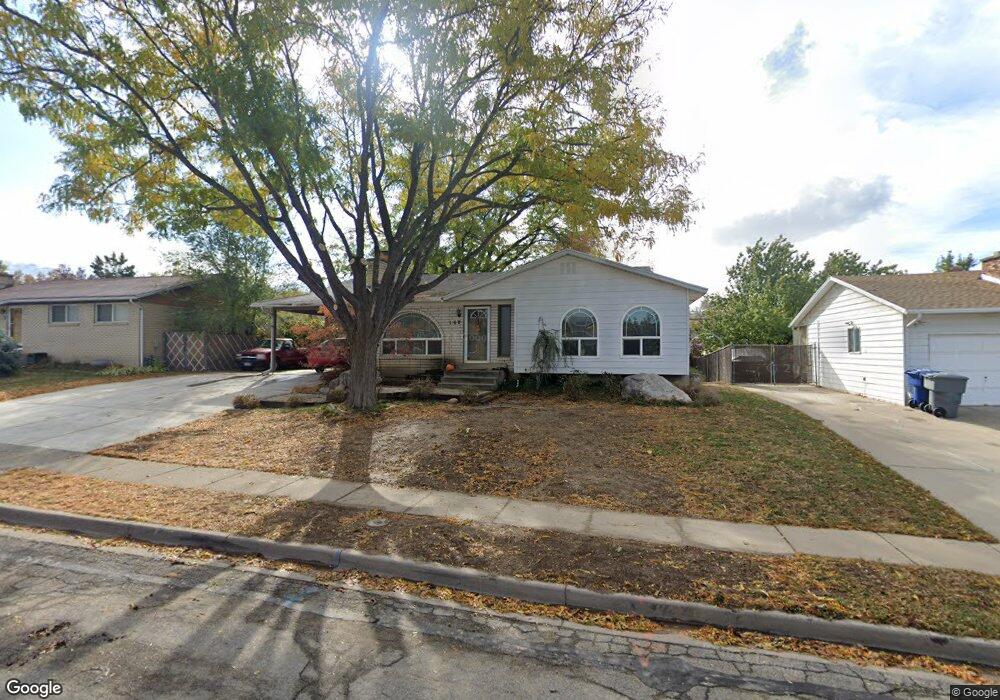
160 Cobble Creek Rd North Salt Lake, UT 84054
Estimated Value: $474,000 - $501,000
4
Beds
2
Baths
2,238
Sq Ft
$217/Sq Ft
Est. Value
About This Home
This home is located at 160 Cobble Creek Rd, North Salt Lake, UT 84054 and is currently estimated at $486,447, approximately $217 per square foot. 160 Cobble Creek Rd is a home located in Davis County with nearby schools including Adelaide School, South Davis Junior High School, and Woods Cross High School.
Ownership History
Date
Name
Owned For
Owner Type
Purchase Details
Closed on
Jul 30, 2013
Sold by
Roberts Wendy L and Roberts Wendy W
Bought by
Saldivar Thomas J and Saldivar Cheryl L
Current Estimated Value
Home Financials for this Owner
Home Financials are based on the most recent Mortgage that was taken out on this home.
Original Mortgage
$177,187
Outstanding Balance
$131,732
Interest Rate
4.46%
Mortgage Type
VA
Estimated Equity
$354,715
Purchase Details
Closed on
Apr 11, 2008
Sold by
Roberts David and Roberts David L
Bought by
Roberts Wendy L and Roberts Wendy W
Purchase Details
Closed on
Dec 24, 1998
Sold by
Roberts Wendy L
Bought by
Roberts David and Roberts Wendy
Home Financials for this Owner
Home Financials are based on the most recent Mortgage that was taken out on this home.
Original Mortgage
$103,000
Interest Rate
9%
Purchase Details
Closed on
Mar 13, 1997
Sold by
Roberts David L
Bought by
Roberts Wendy L
Create a Home Valuation Report for This Property
The Home Valuation Report is an in-depth analysis detailing your home's value as well as a comparison with similar homes in the area
Home Values in the Area
Average Home Value in this Area
Purchase History
| Date | Buyer | Sale Price | Title Company |
|---|---|---|---|
| Saldivar Thomas J | -- | North American Title | |
| Roberts Wendy L | -- | None Available | |
| Roberts David | -- | United Title Services Of Uta | |
| Roberts Wendy L | -- | First American Title Co |
Source: Public Records
Mortgage History
| Date | Status | Borrower | Loan Amount |
|---|---|---|---|
| Open | Saldivar Thomas J | $177,187 | |
| Previous Owner | Roberts David | $103,000 |
Source: Public Records
Tax History Compared to Growth
Tax History
| Year | Tax Paid | Tax Assessment Tax Assessment Total Assessment is a certain percentage of the fair market value that is determined by local assessors to be the total taxable value of land and additions on the property. | Land | Improvement |
|---|---|---|---|---|
| 2025 | $2,480 | $245,300 | $108,150 | $137,150 |
| 2024 | $2,400 | $241,451 | $114,604 | $126,847 |
| 2023 | $2,244 | $408,000 | $151,215 | $256,785 |
| 2022 | $2,319 | $231,550 | $134,972 | $96,578 |
| 2021 | $2,106 | $319,000 | $96,220 | $222,780 |
| 2020 | $1,895 | $284,000 | $82,398 | $201,602 |
| 2019 | $1,902 | $278,000 | $85,698 | $192,302 |
| 2018 | $1,737 | $251,000 | $84,339 | $166,661 |
| 2016 | $1,467 | $112,805 | $33,436 | $79,369 |
| 2015 | $1,390 | $102,630 | $33,436 | $69,194 |
| 2014 | $1,310 | $98,583 | $33,436 | $65,147 |
| 2013 | -- | $98,077 | $25,987 | $72,090 |
Source: Public Records
Map
Nearby Homes
- 410 N 175 E
- 3573 S Highway 89
- 562 Lancelot Dr Unit 60
- 167 Guenevere St Unit 128
- 252 E Kirsten Ln
- 621 Excalibur St Unit 143
- 284 N 100 E
- 626 Sagramore St
- 246 Galahad St
- 189 E 210 N Unit 8
- 259 Lionel St Unit 373
- 246 N Glenwood Way
- 785 Percival St
- 757 W 3200 S
- 298 Percival St Unit 354
- 70 E North Town Ln
- 2420 S Orchard Dr
- 3238 S 675 W
- 310 N 675 E
- 93 N Valley View Dr
- 170 Cobble Creek Rd
- 150 Cobble Creek Rd
- 170 Cobblecreek Rd
- 185 E 475 N
- 175 E 475 N
- 195 E 475 N
- 180 Cobble Creek Rd
- 140 Cobble Creek Rd
- 145 Cobble Creek Rd
- 155 Cobble Creek Rd
- 165 E 475 N
- 133 Cobble Creek Rd
- 207 E 475 N
- 165 Cobble Creek Rd
- 190 Cobble Creek Rd
- 130 Cobble Creek Rd
- 125 Cobble Creek Rd
- 149 E 475 N
- 175 Cobble Creek Rd
- 196 E 475 N