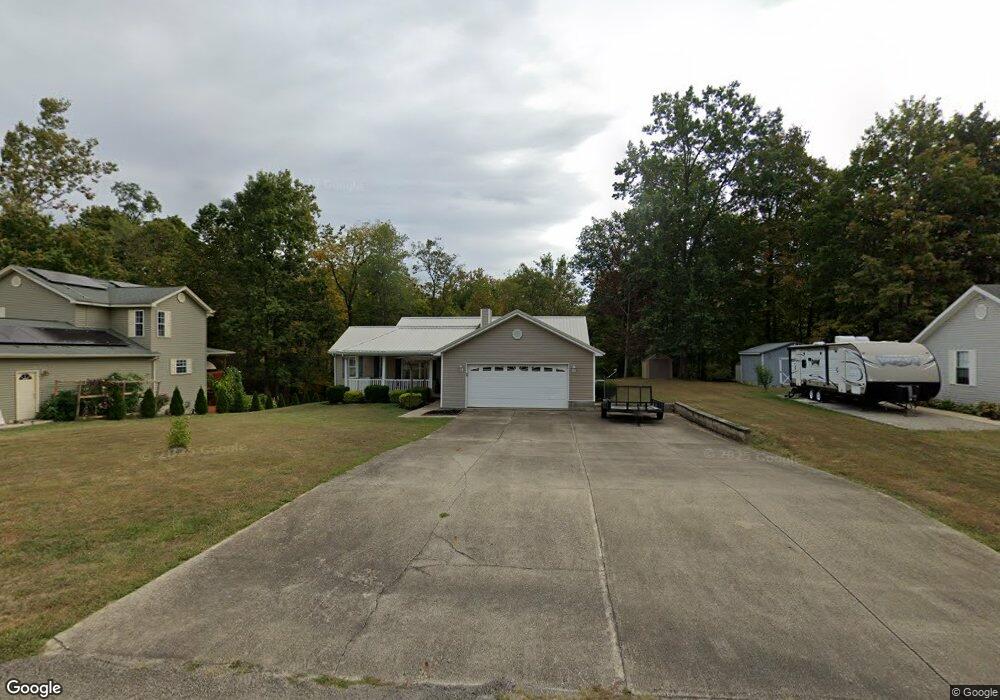
160 Douglas Cir Georgetown, OH 45121
Estimated Value: $245,296 - $300,000
3
Beds
2
Baths
1,560
Sq Ft
$171/Sq Ft
Est. Value
About This Home
This home is located at 160 Douglas Cir, Georgetown, OH 45121 and is currently estimated at $267,324, approximately $171 per square foot. 160 Douglas Cir is a home located in Brown County with nearby schools including Georgetown Elementary School and Georgetown Jr/Sr High School.
Ownership History
Date
Name
Owned For
Owner Type
Purchase Details
Closed on
Sep 24, 2015
Sold by
Smith Albert H and Smith Brenda J
Bought by
Stogsdill Rita K
Current Estimated Value
Purchase Details
Closed on
Nov 18, 2010
Sold by
Cahall Tobias H and Cahall Melissa
Bought by
Smith Albert H and Smith Brenda J
Home Financials for this Owner
Home Financials are based on the most recent Mortgage that was taken out on this home.
Original Mortgage
$80,000
Interest Rate
4.17%
Mortgage Type
Seller Take Back
Purchase Details
Closed on
Nov 3, 2005
Sold by
Bulow Ronald D
Bought by
Cahall Tobias H
Home Financials for this Owner
Home Financials are based on the most recent Mortgage that was taken out on this home.
Original Mortgage
$113,600
Interest Rate
6.12%
Mortgage Type
FHA
Purchase Details
Closed on
Apr 29, 2005
Sold by
J R Partnership
Bought by
Bulow Ronald D
Create a Home Valuation Report for This Property
The Home Valuation Report is an in-depth analysis detailing your home's value as well as a comparison with similar homes in the area
Home Values in the Area
Average Home Value in this Area
Purchase History
| Date | Buyer | Sale Price | Title Company |
|---|---|---|---|
| Stogsdill Rita K | $178,667 | Attorney | |
| Smith Albert H | $130,000 | Attorney | |
| Cahall Tobias H | $142,000 | -- | |
| Bulow Ronald D | $17,500 | -- |
Source: Public Records
Mortgage History
| Date | Status | Borrower | Loan Amount |
|---|---|---|---|
| Previous Owner | Smith Albert H | $80,000 | |
| Previous Owner | Cahall Tobias H | $113,600 |
Source: Public Records
Tax History
| Year | Tax Paid | Tax Assessment Tax Assessment Total Assessment is a certain percentage of the fair market value that is determined by local assessors to be the total taxable value of land and additions on the property. | Land | Improvement |
|---|---|---|---|---|
| 2024 | $2,133 | $70,020 | $9,710 | $60,310 |
| 2023 | $1,779 | $55,320 | $8,400 | $46,920 |
| 2022 | $1,796 | $55,320 | $8,400 | $46,920 |
| 2021 | $1,780 | $55,320 | $8,400 | $46,920 |
| 2020 | $1,515 | $46,100 | $7,000 | $39,100 |
| 2019 | $1,505 | $46,100 | $7,000 | $39,100 |
| 2018 | $1,885 | $46,100 | $7,000 | $39,100 |
| 2017 | $1,445 | $41,680 | $7,700 | $33,980 |
| 2016 | $1,444 | $41,680 | $7,700 | $33,980 |
| 2015 | $1,463 | $41,680 | $7,700 | $33,980 |
| 2014 | $1,499 | $40,980 | $7,000 | $33,980 |
| 2013 | $1,494 | $40,980 | $7,000 | $33,980 |
Source: Public Records
Map
Nearby Homes
- 175 Douglas Cir
- 20 Douglas Cir
- 25 Douglas Ln
- 20 Lakeview Acres Dr
- 155 Free Soil Rd
- 708 E State St
- 666 E State St
- 470 Free Soil Rd
- 505 S Water St
- 406 E North St
- 60 New St
- 399 Elmwood Ct
- 401 Elmwood Ct
- 405 N Main St
- 0 St Rt 221 & Footbridge Unit 1826509
- 508 Mount Orab Pike
- 427 Kenwood Ave
- 1 N Kenwood Ave
- 2 N Kenwood Ave
- 7029 Free Soil Rd
- 170 Douglas Cir
- 150 Douglas Cir
- 165 Douglas Cir
- 95 Douglas Cir
- 140 Douglas Cir
- 180 Douglas Cir
- 185 Douglas Cir
- 130 Douglas Cir
- 195 Douglas Cir
- 85 Douglas Cir
- 190 Douglas Cir
- 120 Douglas Cir
- 75 Douglas Cir
- 110 Douglas Cir
- 200 Douglas Cir
- 55 Douglas Cir
- 215 Douglas Cir
- 210 Douglas Cir
- 90 Douglas Cir
- 80 Douglas Cir
Your Personal Tour Guide
Ask me questions while you tour the home.