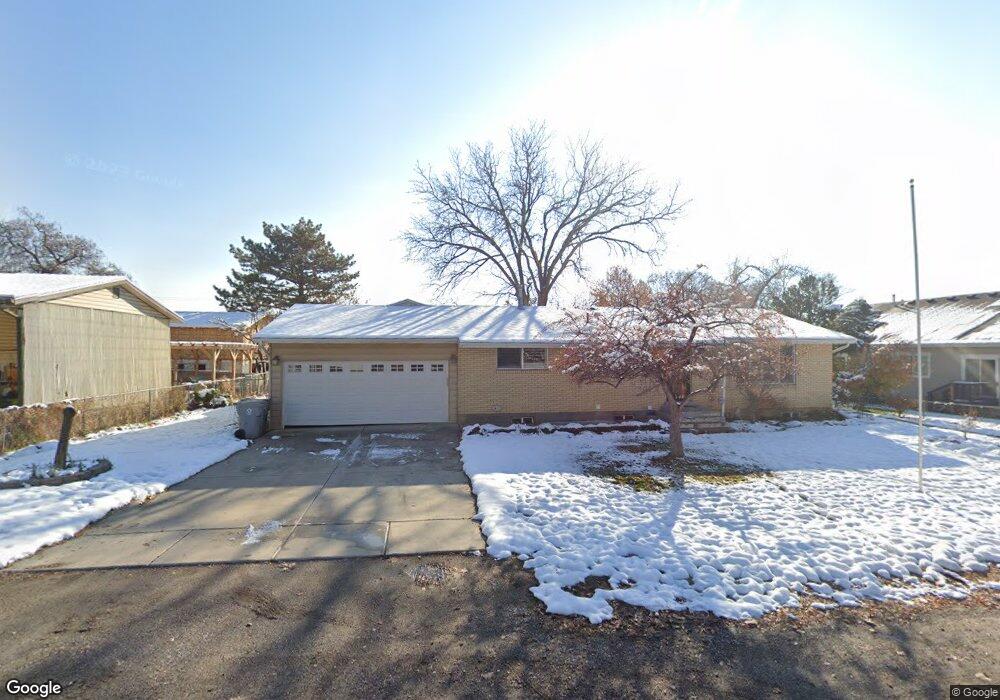
160 E 100 N Pleasant Grove, UT 84062
Estimated Value: $469,000 - $556,842
4
Beds
3
Baths
1,699
Sq Ft
$310/Sq Ft
Est. Value
About This Home
This home is located at 160 E 100 N, Pleasant Grove, UT 84062 and is currently estimated at $526,281, approximately $309 per square foot. 160 E 100 N is a home located in Utah County with nearby schools including Central Elementary School, Pleasant Grove Junior High School, and Pleasant Grove High School.
Ownership History
Date
Name
Owned For
Owner Type
Purchase Details
Closed on
Sep 16, 2025
Sold by
Fotheringham Residential Trust and Fotheringham Richard S
Bought by
Anderson Shelly Marie
Current Estimated Value
Purchase Details
Closed on
Jun 30, 2014
Sold by
Fotheringham Alan Jay and Fotheringham Dale Cynthia
Bought by
Fotheringham Residential Trust
Purchase Details
Closed on
Apr 8, 2014
Sold by
Tafoya Deann F
Bought by
Dale Cynthia A and Woodland Amber Lee
Purchase Details
Closed on
Dec 2, 2013
Sold by
Fotheringham Alan Jay and D J Fotheringham Trust
Bought by
Tafoya Deann F and Fotheringham Alan Jay
Purchase Details
Closed on
Dec 4, 2009
Sold by
Fotheringham Delose Grant
Bought by
Fotheringham Delose Grant and D J Fotheringham Trust
Create a Home Valuation Report for This Property
The Home Valuation Report is an in-depth analysis detailing your home's value as well as a comparison with similar homes in the area
Home Values in the Area
Average Home Value in this Area
Purchase History
| Date | Buyer | Sale Price | Title Company |
|---|---|---|---|
| Anderson Shelly Marie | -- | Real Advantage Title | |
| Fotheringham Residential Trust | -- | None Available | |
| Dale Cynthia A | -- | None Available | |
| Tafoya Deann F | -- | None Available | |
| Fotheringham Delose Grant | -- | None Available |
Source: Public Records
Tax History
| Year | Tax Paid | Tax Assessment Tax Assessment Total Assessment is a certain percentage of the fair market value that is determined by local assessors to be the total taxable value of land and additions on the property. | Land | Improvement |
|---|---|---|---|---|
| 2025 | $2,352 | $287,155 | -- | -- |
| 2024 | $2,258 | $274,505 | $0 | $0 |
| 2023 | $2,158 | $275,880 | $0 | $0 |
| 2022 | $2,158 | $262,295 | $0 | $0 |
| 2021 | $1,862 | $344,700 | $154,800 | $189,900 |
| 2020 | $1,551 | $310,800 | $138,200 | $172,600 |
| 2019 | $1,551 | $291,000 | $127,000 | $164,000 |
| 2018 | $1,500 | $266,100 | $115,800 | $150,300 |
| 2017 | $1,383 | $130,680 | $0 | $0 |
| 2016 | $0 | $120,285 | $0 | $0 |
| 2015 | -- | $110,495 | $0 | $0 |
| 2014 | -- | $109,230 | $0 | $0 |
Source: Public Records
Map
Nearby Homes
- 35 S 100 E
- 77 N Main St
- 165 S 200 E
- 240 Grove Creek Dr
- 577 N 400 E
- 384 E 300 S
- 563 E 500 N Unit 3
- 525 E 200 N
- 412 S 350 E
- 312 N 440 W
- 825 N 350 E
- 642 E Center St
- 344 E 900 N
- 557 E 200 N Unit 2
- 795 N 535 E
- 435 E 790 S Unit 8
- 494 E Apple Blossom Dr
- 641 E 700 N
- 169 S Pleasant Grove Blvd Unit 51
- 540 E 990 N
Your Personal Tour Guide
Ask me questions while you tour the home.