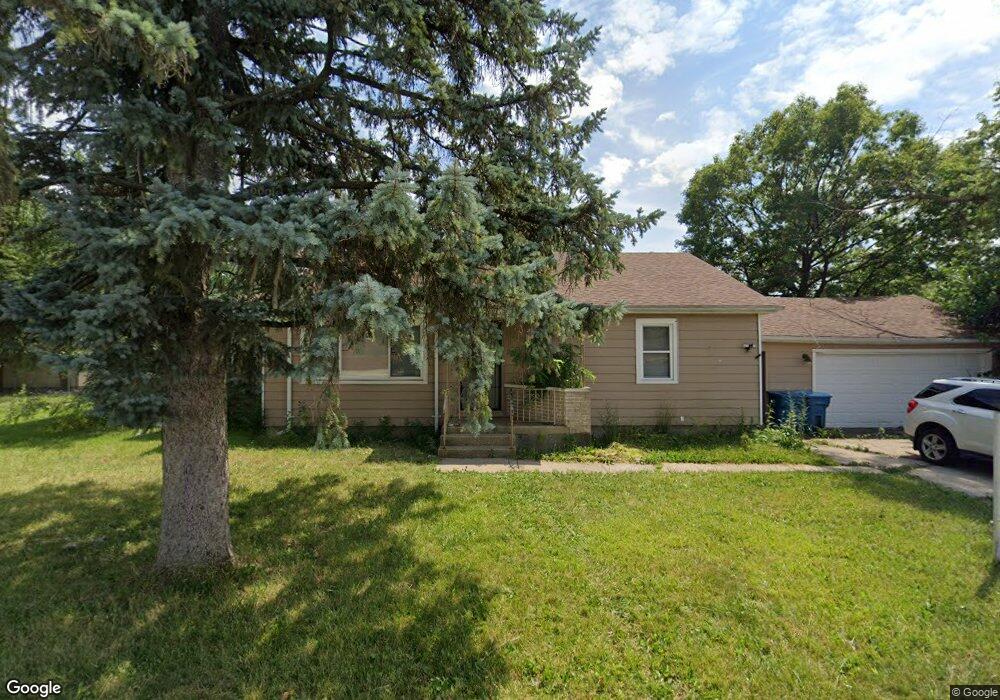
160 E 145th St Harvey, IL 60426
Estimated Value: $86,219 - $193,000
4
Beds
3
Baths
1,532
Sq Ft
$99/Sq Ft
Est. Value
About This Home
This home is located at 160 E 145th St, Harvey, IL 60426 and is currently estimated at $151,805, approximately $99 per square foot. 160 E 145th St is a home located in Cook County with nearby schools including Riley Early Childhood Center, Brooks Middle School, and Thornton Township High School.
Ownership History
Date
Name
Owned For
Owner Type
Purchase Details
Closed on
Feb 24, 2020
Sold by
Hhtp1 Llc
Bought by
Johnson Eugene
Current Estimated Value
Purchase Details
Closed on
Jan 20, 2016
Sold by
Hometown Communlty Development Corp
Bought by
Hhtp1 Llc
Home Financials for this Owner
Home Financials are based on the most recent Mortgage that was taken out on this home.
Original Mortgage
$6,128,000
Interest Rate
3.92%
Mortgage Type
Future Advance Clause Open End Mortgage
Purchase Details
Closed on
Aug 1, 2014
Sold by
Bank Of America Na
Bought by
Hometown Community Development Corporati and Homestrong Usa
Purchase Details
Closed on
Jul 25, 2014
Sold by
Green Steven Paul
Bought by
Bank Of America Na
Purchase Details
Closed on
Feb 19, 2014
Sold by
Green Steven Paul
Bought by
Bank Of America Na and Fannie Mae Remic Trust
Create a Home Valuation Report for This Property
The Home Valuation Report is an in-depth analysis detailing your home's value as well as a comparison with similar homes in the area
Home Values in the Area
Average Home Value in this Area
Purchase History
| Date | Buyer | Sale Price | Title Company |
|---|---|---|---|
| Johnson Eugene | $41,000 | Attorney | |
| Hhtp1 Llc | -- | Attorney | |
| Hometown Community Development Corporati | -- | None Available | |
| Bank Of America Na | -- | None Available | |
| Bank Of America Na | -- | None Available |
Source: Public Records
Mortgage History
| Date | Status | Borrower | Loan Amount |
|---|---|---|---|
| Previous Owner | Hhtp1 Llc | $6,128,000 |
Source: Public Records
Tax History
| Year | Tax Paid | Tax Assessment Tax Assessment Total Assessment is a certain percentage of the fair market value that is determined by local assessors to be the total taxable value of land and additions on the property. | Land | Improvement |
|---|---|---|---|---|
| 2025 | $2,335 | $3,573 | $1,045 | $2,528 |
| 2024 | $2,335 | $3,573 | $1,045 | $2,528 |
| 2023 | $1,959 | $3,573 | $1,045 | $2,528 |
| 2022 | $1,959 | $2,409 | $1,045 | $1,364 |
| 2021 | $1,893 | $2,409 | $1,045 | $1,364 |
| 2020 | $692 | $2,409 | $1,045 | $1,364 |
| 2019 | $1,863 | $4,115 | $950 | $3,165 |
| 2018 | $1,815 | $4,115 | $950 | $3,165 |
| 2017 | $1,796 | $4,115 | $950 | $3,165 |
| 2016 | $1,628 | $3,763 | $855 | $2,908 |
| 2015 | $1,524 | $3,763 | $855 | $2,908 |
| 2014 | $1,537 | $3,763 | $855 | $2,908 |
| 2013 | $2,008 | $4,616 | $855 | $3,761 |
Source: Public Records
Map
Nearby Homes
- 14502 Kentucky Ave
- 14519 Harvey Ave
- 111 E 144th Ct
- 14501 Peoria St
- 14452 Green St
- 14609 Lexington Ave
- 14631 Vincennes Rd
- 14427 Halsted St
- 14446 Des Plaines St
- 14438 Des Plaines St
- 306 Calumet Blvd
- 14631 Union Ave
- 14525 Justine St
- 14735 Myrtle Ave
- 14455 Des Plaines St
- 14443 Des Plaines St
- 345 Calumet Blvd
- 380 Calumet Blvd
- 272 E 148th St
- 14506 Clinton St
- 160 E 145th St
- 14505 Vincennes Rd
- 14505 Vincennes Rd
- 14508 Center Ave
- 14508 Center Ave
- 14438 Center Ave
- 14436 Center Ave
- 14505 Center Ave
- 14432 Center Ave
- 14512 Center Ave
- 14512 Center Ave
- 14501 Center Ave
- 14511 Kentucky Ave
- 14509 Center Ave
- 14431 Vincennes Rd
- 14430 Center Ave
- 14513 Center Ave
- 14459 Center Ave
- 14519 Center Ave
- 14429 Vincennes Rd
Your Personal Tour Guide
Ask me questions while you tour the home.