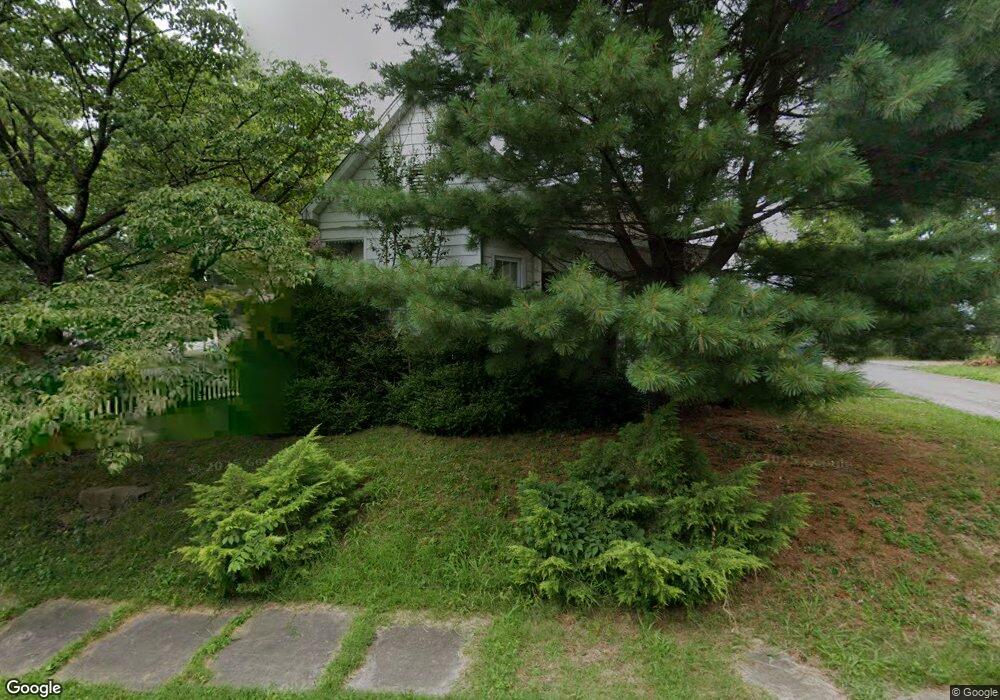
160 E Main St Elberfeld, IN 47613
Estimated Value: $174,381 - $256,000
2
Beds
1
Bath
1,308
Sq Ft
$156/Sq Ft
Est. Value
About This Home
This home is located at 160 E Main St, Elberfeld, IN 47613 and is currently estimated at $204,095, approximately $156 per square foot. 160 E Main St is a home located in Warrick County with nearby schools including Elberfeld Elementary School and Tecumseh High School.
Ownership History
Date
Name
Owned For
Owner Type
Purchase Details
Closed on
Nov 25, 2019
Sold by
Koziol David A
Bought by
York Stephanie Hope
Current Estimated Value
Purchase Details
Closed on
Oct 31, 2007
Sold by
Howard Candace J
Bought by
York Stephanie Hope
Home Financials for this Owner
Home Financials are based on the most recent Mortgage that was taken out on this home.
Original Mortgage
$57,600
Interest Rate
6.44%
Mortgage Type
New Conventional
Purchase Details
Closed on
Apr 13, 2007
Sold by
Bank Of New York
Bought by
Howard Candace J
Purchase Details
Closed on
Jan 23, 2007
Sold by
Countrywide Home Loans Inc
Bought by
Bank Of New York
Purchase Details
Closed on
Jan 12, 2007
Sold by
Tennyson Sherry D
Bought by
Countrywide Home Loans Inc
Create a Home Valuation Report for This Property
The Home Valuation Report is an in-depth analysis detailing your home's value as well as a comparison with similar homes in the area
Purchase History
| Date | Buyer | Sale Price | Title Company |
|---|---|---|---|
| York Stephanie Hope | -- | None Available | |
| York Stephanie Hope | -- | None Available | |
| Howard Candace J | -- | Investors Title Corp | |
| Bank Of New York | -- | None Available | |
| Countrywide Home Loans Inc | -- | None Available |
Source: Public Records
Mortgage History
| Date | Status | Borrower | Loan Amount |
|---|---|---|---|
| Previous Owner | York Stephanie Hope | $57,600 |
Source: Public Records
Tax History
| Year | Tax Paid | Tax Assessment Tax Assessment Total Assessment is a certain percentage of the fair market value that is determined by local assessors to be the total taxable value of land and additions on the property. | Land | Improvement |
|---|---|---|---|---|
| 2024 | $867 | $127,800 | $33,400 | $94,400 |
| 2023 | $853 | $124,600 | $21,800 | $102,800 |
| 2022 | $779 | $114,200 | $21,800 | $92,400 |
| 2021 | $684 | $97,400 | $21,800 | $75,600 |
| 2020 | $600 | $90,200 | $21,800 | $68,400 |
| 2019 | $660 | $93,200 | $21,800 | $71,400 |
| 2018 | $583 | $88,500 | $21,800 | $66,700 |
| 2017 | $492 | $82,200 | $21,800 | $60,400 |
| 2016 | $475 | $81,600 | $21,800 | $59,800 |
| 2014 | $400 | $77,300 | $17,300 | $60,000 |
| 2013 | $391 | $77,800 | $17,300 | $60,500 |
Source: Public Records
Map
Nearby Homes
- 355 W Walnut St
- 375 W Main St
- New Harmony Rd
- 11499 Nobles Chapel Rd
- 0 950 Rd S Unit 202437585
- 1300 S County Rd
- 5180 E 1200 S
- 11299 Indiana 68
- 9264 Indiana 57
- 2352 E Warrenton Rd
- 18530 Somerville Ct
- 13918 Persimmon Ln
- 14914 Mccutchan Rd
- 13800 Prairie Dr
- 12444 Brook Dr
- 13621 Prairie Dr
- AMY Plan at Cambridge Golf Course Village
- HARPER Plan at Cambridge Golf Course Village
- The Fontaine Plan at Creekside Meadows
- The Hudson Plan at Creekside Meadows
- 175 W Walnut St
- 125 W Main St Unit LOT 54 & E 1/2 LOT 5
- 125 W Main St
- 75 S 2nd St
- 240 W Main St
- 8827 S Rural Route 2
- 170 W Walnut St
- 170 N 1st St
- 190 N 1st St
- 255 W Walnut St
- 210 W Walnut St
- 123 S 1st St
- 230 W Walnut St
- 275 W Main St
- 270 W Main St
- 60 W Main St
- 110 W Sycamore St
- 50 S 2nd St
- 110 Sycamore St
- 130 N 1st St
Your Personal Tour Guide
Ask me questions while you tour the home.