Estimated Value: $445,186 - $530,000
4
Beds
3
Baths
3,000
Sq Ft
$165/Sq Ft
Est. Value
About This Home
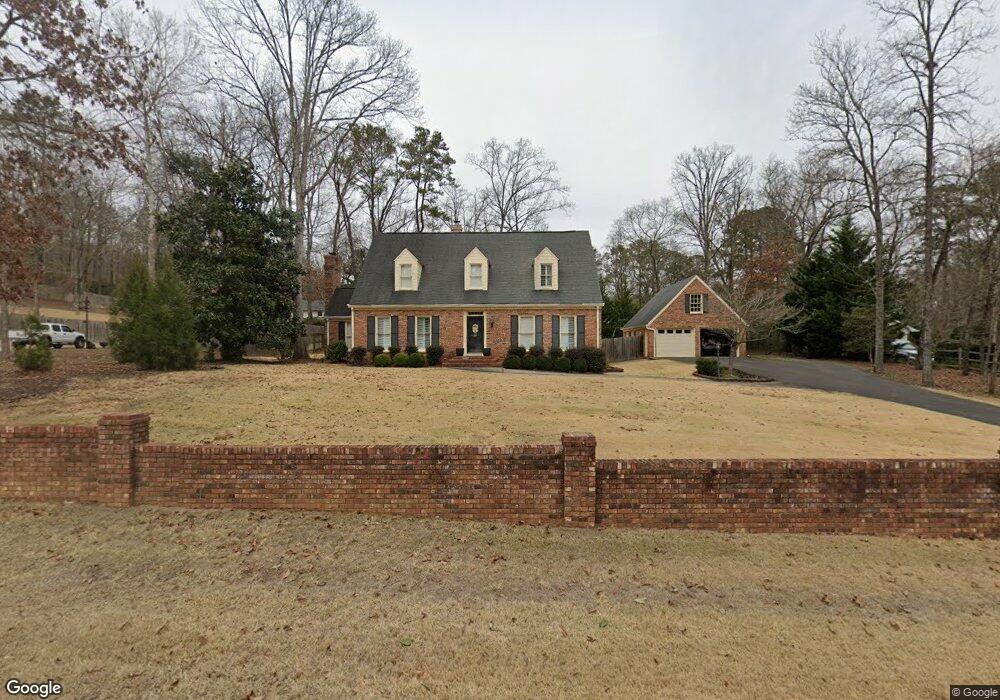
This home is located at 160 Featherston Rd SW, Rome, GA 30165 and is currently estimated at $494,297, approximately $164 per square foot. 160 Featherston Rd SW is a home located in Floyd County with nearby schools including Coosa Middle School and Coosa High School.
Ownership History
Date
Name
Owned For
Owner Type
Purchase Details
Closed on
May 28, 2004
Sold by
Lawrence John B and Lawrence Linda M
Bought by
Crane Matthew Tyler and Christina Ree
Current Estimated Value
Purchase Details
Closed on
Dec 27, 2000
Sold by
Smith Stephen David and Nancy Loveday S
Bought by
Lawrence John B and Lawrence Linda M
Purchase Details
Closed on
Apr 20, 1983
Sold by
Dohrmann David M
Bought by
Smith Stephen David and Nancy Love
Purchase Details
Closed on
Mar 15, 1983
Sold by
P\R
Bought by
Dohrmann David M
Purchase Details
Closed on
May 30, 1975
Sold by
Dohrmann David M and Dohrmann Carolyn S
Bought by
P\R
Purchase Details
Closed on
May 9, 1975
Sold by
Covington Jim & Co
Bought by
Dohrmann David M and Dohrmann Carolyn S
Purchase Details
Closed on
Jan 1, 1901
Bought by
Covington Jim & Co
Create a Home Valuation Report for This Property
The Home Valuation Report is an in-depth analysis detailing your home's value as well as a comparison with similar homes in the area
Home Values in the Area
Average Home Value in this Area
Purchase History
| Date | Buyer | Sale Price | Title Company |
|---|---|---|---|
| Crane Matthew Tyler | $276,400 | -- | |
| Lawrence John B | $220,000 | -- | |
| Smith Stephen David | $104,700 | -- | |
| Dohrmann David M | -- | -- | |
| P\R | -- | -- | |
| Dohrmann David M | $9,000 | -- | |
| Covington Jim & Co | -- | -- |
Source: Public Records
Tax History Compared to Growth
Tax History
| Year | Tax Paid | Tax Assessment Tax Assessment Total Assessment is a certain percentage of the fair market value that is determined by local assessors to be the total taxable value of land and additions on the property. | Land | Improvement |
|---|---|---|---|---|
| 2024 | $4,464 | $173,419 | $19,716 | $153,703 |
| 2023 | $4,444 | $166,747 | $17,808 | $148,939 |
| 2022 | $4,029 | $141,014 | $14,628 | $126,386 |
| 2021 | $3,708 | $126,029 | $14,628 | $111,401 |
| 2020 | $3,486 | $117,726 | $11,130 | $106,596 |
| 2019 | $3,291 | $112,747 | $11,130 | $101,617 |
| 2018 | $3,142 | $107,594 | $11,130 | $96,464 |
| 2017 | $3,029 | $103,633 | $11,130 | $92,503 |
| 2016 | $3,021 | $102,164 | $11,120 | $91,044 |
| 2015 | $2,960 | $103,244 | $11,120 | $92,124 |
| 2014 | $2,960 | $104,284 | $11,120 | $93,164 |
Source: Public Records
Map
Nearby Homes
- 0 Featherston Rd SW Unit 13890394
- 0 Featherston Rd SW Unit 10512723
- 17 Crestwood Dr SW
- 8 Crestwood Dr SW
- 7 Pine Valley Rd SW
- 20 Pine Valley Rd SW
- 11 Brow Rd SW
- 5 Saint Andrews Way SW
- 0 Hidden Ridge Dr Unit 10343694
- 0 Hidden Ridge Dr Unit 10343706
- 0 Hidden Ridge Dr Unit 10343701
- 0 Hidden Ridge Dr Unit 10343693
- 0 Hidden Ridge Dr Unit 10343685
- 0 Hidden Ridge Dr Unit 10556470
- 0 Hidden Ridge Dr Unit 10343688
- 0 Hidden Ridge Dr Unit 10343680
- 0 Hidden Ridge Dr Unit 10343696
- 0 Hidden Ridge Dr Unit 10343689
- 0 Hidden Ridge Dr Unit 10343700
- 0 Hidden Ridge Dr Unit 10343676
- 144 Featherston Rd SW
- 174 Featherston Rd SW
- 3 Bridlewood Ln SW
- 3 Bridlewood Ln SW Unit GA
- 0 Featherston Rd SW Unit 20033295
- 149 Featherston Rd SW
- 184 Featherston Rd SW
- 102 Featherston Rd SW
- 163 Featherston Rd SW
- 1 Bridlewood Ln SW Unit 100
- 1 Bridlewood Ln SW
- 135 Featherston Rd SW
- 179 Featherston Rd SW
- 202 Pine Valley Rd SW
- 7 Bridlewood Ln SW
- 196 Featherston Rd SW
- 4 Bridlewood Ln SW
- 102 Pine Valley Rd SW
- 100 Featherston Rd SW
- 119 Featherston Rd SW