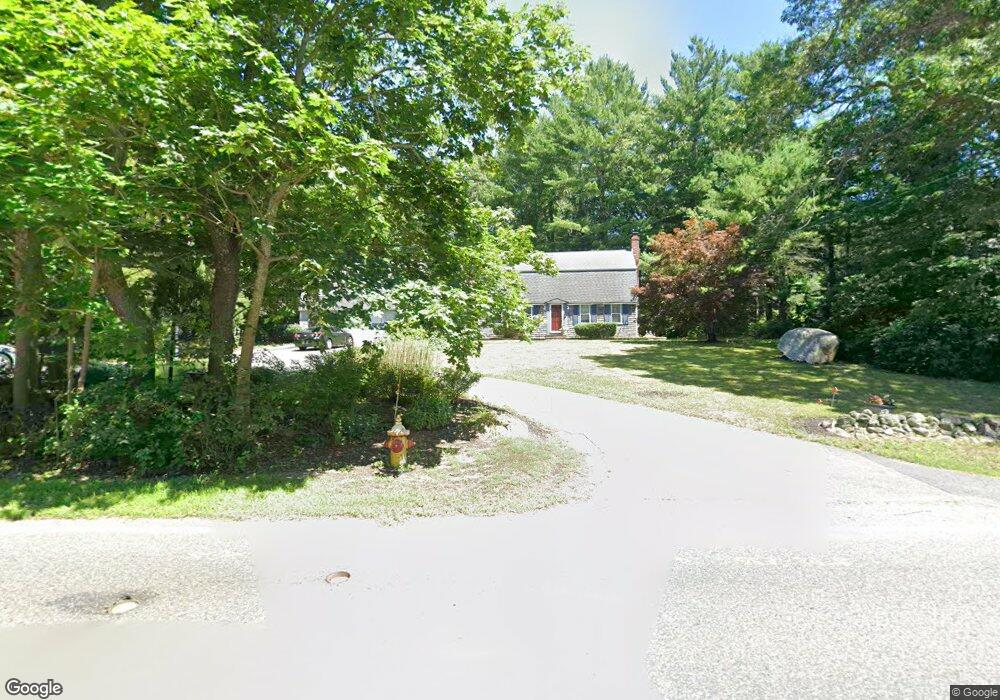
160 Ferry St Marshfield, MA 02050
Estimated Value: $836,000 - $1,284,000
4
Beds
3
Baths
2,831
Sq Ft
$357/Sq Ft
Est. Value
About This Home
This home is located at 160 Ferry St, Marshfield, MA 02050 and is currently estimated at $1,011,641, approximately $357 per square foot. 160 Ferry St is a home located in Plymouth County with nearby schools including South River, Furnace Brook Middle School, and Marshfield High School.
Ownership History
Date
Name
Owned For
Owner Type
Purchase Details
Closed on
Jun 22, 2023
Sold by
Tilley Frederick G
Bought by
Fg Tilley Lt and Tilley
Current Estimated Value
Purchase Details
Closed on
Jul 3, 2012
Sold by
Tilley Priscilla A
Bought by
Tilley Frederick G
Purchase Details
Closed on
Dec 15, 1993
Sold by
Beschi Dorothy C and Cheesman Michael J
Bought by
Tilley Frederick G and Tilley Priscilla A
Create a Home Valuation Report for This Property
The Home Valuation Report is an in-depth analysis detailing your home's value as well as a comparison with similar homes in the area
Home Values in the Area
Average Home Value in this Area
Purchase History
| Date | Buyer | Sale Price | Title Company |
|---|---|---|---|
| Fg Tilley Lt | -- | None Available | |
| Tilley Frederick G | -- | -- | |
| Tilley Frederick G | $249,500 | -- | |
| Tilley Frederick G | $249,500 | -- |
Source: Public Records
Mortgage History
| Date | Status | Borrower | Loan Amount |
|---|---|---|---|
| Previous Owner | Tilley Frederick G | $25,000 | |
| Previous Owner | Tilley Frederick G | $230,000 | |
| Previous Owner | Tilley Frederick G | $40,000 |
Source: Public Records
Tax History
| Year | Tax Paid | Tax Assessment Tax Assessment Total Assessment is a certain percentage of the fair market value that is determined by local assessors to be the total taxable value of land and additions on the property. | Land | Improvement |
|---|---|---|---|---|
| 2025 | $7,839 | $791,800 | $313,000 | $478,800 |
| 2024 | $7,658 | $737,100 | $298,100 | $439,000 |
| 2023 | $7,462 | $659,200 | $276,800 | $382,400 |
| 2022 | $7,165 | $553,300 | $223,500 | $329,800 |
| 2021 | $6,852 | $519,500 | $221,400 | $298,100 |
| 2020 | $6,565 | $492,500 | $202,300 | $290,200 |
| 2019 | $6,378 | $476,700 | $202,300 | $274,400 |
| 2018 | $6,304 | $471,500 | $202,300 | $269,200 |
| 2017 | $6,060 | $441,700 | $191,600 | $250,100 |
| 2016 | $5,763 | $415,200 | $181,000 | $234,200 |
| 2015 | $5,448 | $409,900 | $181,000 | $228,900 |
| 2014 | $5,242 | $394,400 | $166,100 | $228,300 |
Source: Public Records
Map
Nearby Homes
- 14 Ferry St
- 235 Main St
- 341 Furnace St
- 39 High Beacon Way
- 10 Spyglass Landing Dr
- 16 Schooner Way
- 29 Spyglass Landing Dr
- 290 S River St
- 92 Salt Meadow Waye
- 86 Telegraph Hill Rd
- 167 Planting Field Rd
- 566 Holly Rd
- 2 Proprietors Dr Unit 25
- 2 Proprietors Dr Unit 26
- 2 Proprietors Dr Unit 27
- 3 Red Pony Path Unit 3
- 889 Old Main Street Extension
- 1192 S River St
- 6 Maple Ln
- 7 Pierce Rd
- 170 Ferry St
- 150 Ferry St
- 26 Strawberry Farm Rd
- lot B Ferry St
- 18 Strawberry Farm Rd
- Lot 17 Strawberry Farm Rd
- Lot 14 Strawberry Farm Rd
- Lot 16 Strawberry Farm Rd
- Lot 3 Strawberry Farm Rd
- 144 Ferry St
- 30 Strawberry Farm Rd
- 8 Strawberry Farm Rd
- Lot 8 Strawberry Farm Rd
- 19 Strawberry Farm Rd
- 23 Strawberry Farm Rd
- 167 Ferry St
- 136 Ferry St
- Lot 19 Strawberry Farm Rd
- 29 Strawberry Farm Rd
- 15 Strawberry Farm Rd
Your Personal Tour Guide
Ask me questions while you tour the home.