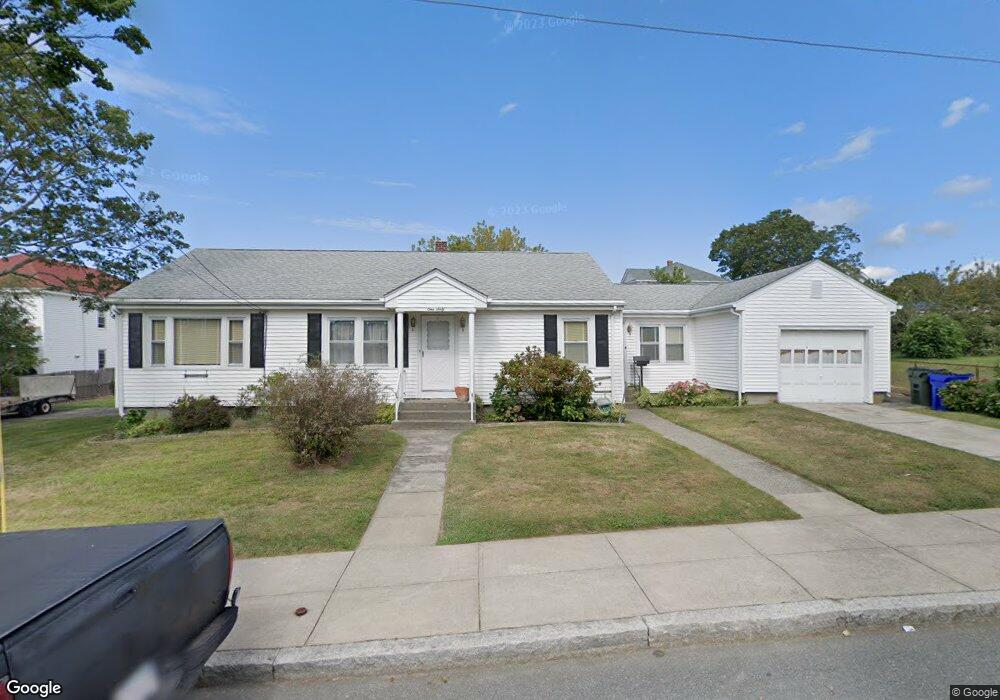
160 Field St Fall River, MA 02721
Maplewood NeighborhoodEstimated Value: $390,664 - $420,000
3
Beds
1
Bath
1,144
Sq Ft
$349/Sq Ft
Est. Value
About This Home
This home is located at 160 Field St, Fall River, MA 02721 and is currently estimated at $399,666, approximately $349 per square foot. 160 Field St is a home located in Bristol County with nearby schools including Letourneau Elementary School, Matthew J. Kuss Middle School, and B M C Durfee High School.
Ownership History
Date
Name
Owned For
Owner Type
Purchase Details
Closed on
Oct 27, 2021
Sold by
Joseph F Xavier Ret and Xavier
Bought by
Paiva Joshua and Moniz Savannah
Current Estimated Value
Home Financials for this Owner
Home Financials are based on the most recent Mortgage that was taken out on this home.
Original Mortgage
$302,421
Outstanding Balance
$273,978
Interest Rate
2.8%
Mortgage Type
FHA
Estimated Equity
$125,688
Purchase Details
Closed on
Feb 18, 2011
Sold by
Xavier Joseph F
Bought by
Joseph F Xavier Ret and Xavier
Create a Home Valuation Report for This Property
The Home Valuation Report is an in-depth analysis detailing your home's value as well as a comparison with similar homes in the area
Home Values in the Area
Average Home Value in this Area
Purchase History
| Date | Buyer | Sale Price | Title Company |
|---|---|---|---|
| Paiva Joshua | $308,000 | None Available | |
| Joseph F Xavier Ret | -- | -- |
Source: Public Records
Mortgage History
| Date | Status | Borrower | Loan Amount |
|---|---|---|---|
| Open | Paiva Joshua | $302,421 |
Source: Public Records
Tax History
| Year | Tax Paid | Tax Assessment Tax Assessment Total Assessment is a certain percentage of the fair market value that is determined by local assessors to be the total taxable value of land and additions on the property. | Land | Improvement |
|---|---|---|---|---|
| 2025 | $3,843 | $335,600 | $131,800 | $203,800 |
| 2024 | $3,603 | $313,600 | $126,800 | $186,800 |
| 2023 | $3,456 | $281,700 | $108,700 | $173,000 |
| 2022 | $3,035 | $240,500 | $98,800 | $141,700 |
| 2021 | $2,893 | $209,200 | $91,400 | $117,800 |
| 2020 | $2,792 | $193,200 | $87,500 | $105,700 |
| 2019 | $2,651 | $181,800 | $83,300 | $98,500 |
| 2018 | $2,537 | $173,500 | $81,800 | $91,700 |
| 2017 | $2,430 | $173,600 | $83,400 | $90,200 |
| 2016 | $2,357 | $172,900 | $86,900 | $86,000 |
| 2015 | $2,220 | $169,700 | $83,700 | $86,000 |
| 2014 | $2,190 | $174,100 | $88,100 | $86,000 |
Source: Public Records
Map
Nearby Homes
Your Personal Tour Guide
Ask me questions while you tour the home.