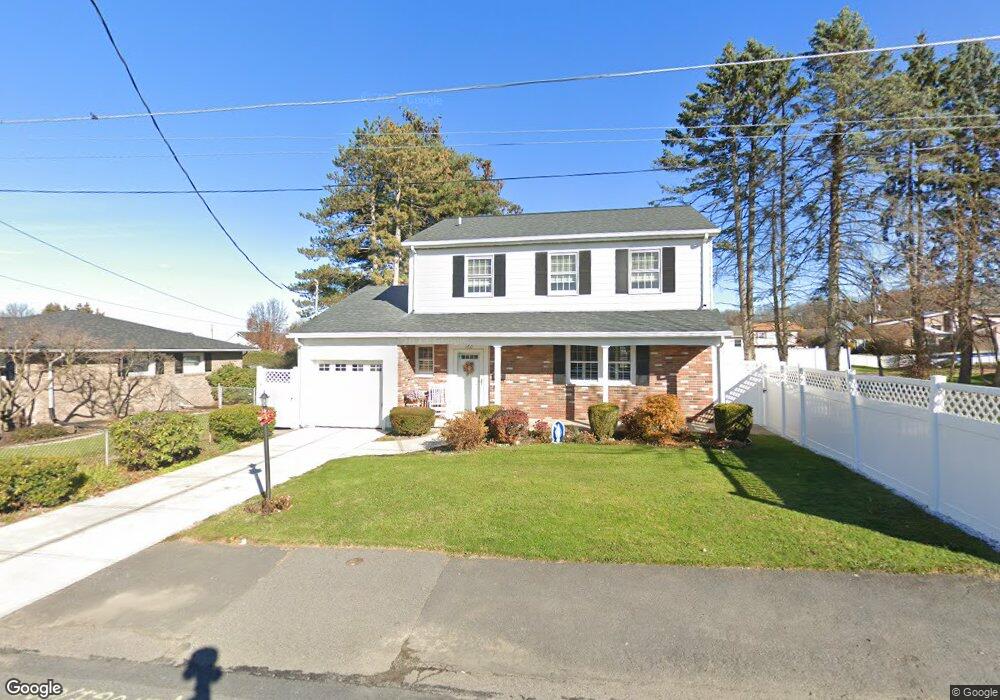
160 Flag St Pittston, PA 18640
Estimated Value: $224,000 - $372,000
--
Bed
--
Bath
2,058
Sq Ft
$144/Sq Ft
Est. Value
About This Home
This home is located at 160 Flag St, Pittston, PA 18640 and is currently estimated at $296,152, approximately $143 per square foot. 160 Flag St is a home located in Luzerne County with nearby schools including Pittston City Intermediate Center, Pittston Area Middle School, and Frederick County Middle School.
Ownership History
Date
Name
Owned For
Owner Type
Purchase Details
Closed on
Jan 24, 2006
Sold by
Licata Charles and Licata Elizabeth
Bought by
Licata Charles and Licata Elizabeth
Current Estimated Value
Home Financials for this Owner
Home Financials are based on the most recent Mortgage that was taken out on this home.
Original Mortgage
$66,660
Outstanding Balance
$37,837
Interest Rate
6.34%
Mortgage Type
Purchase Money Mortgage
Estimated Equity
$258,315
Purchase Details
Closed on
Jun 15, 1982
Bought by
Zangardi Alfonso and Zangardi Barbara
Create a Home Valuation Report for This Property
The Home Valuation Report is an in-depth analysis detailing your home's value as well as a comparison with similar homes in the area
Home Values in the Area
Average Home Value in this Area
Purchase History
| Date | Buyer | Sale Price | Title Company |
|---|---|---|---|
| Licata Charles | -- | None Available | |
| Zangardi Alfonso | -- | -- |
Source: Public Records
Mortgage History
| Date | Status | Borrower | Loan Amount |
|---|---|---|---|
| Open | Licata Charles | $66,660 |
Source: Public Records
Tax History Compared to Growth
Tax History
| Year | Tax Paid | Tax Assessment Tax Assessment Total Assessment is a certain percentage of the fair market value that is determined by local assessors to be the total taxable value of land and additions on the property. | Land | Improvement |
|---|---|---|---|---|
| 2025 | $4,389 | $177,000 | $29,200 | $147,800 |
| 2024 | $4,318 | $177,000 | $29,200 | $147,800 |
| 2023 | $4,318 | $177,000 | $29,200 | $147,800 |
| 2022 | $4,197 | $177,000 | $29,200 | $147,800 |
| 2021 | $4,153 | $177,000 | $29,200 | $147,800 |
| 2020 | $4,054 | $177,000 | $29,200 | $147,800 |
| 2019 | $4,019 | $177,000 | $29,200 | $147,800 |
| 2018 | $3,887 | $177,000 | $29,200 | $147,800 |
| 2017 | $3,797 | $177,000 | $29,200 | $147,800 |
| 2016 | -- | $177,000 | $29,200 | $147,800 |
| 2015 | $3,133 | $177,000 | $29,200 | $147,800 |
| 2014 | $3,133 | $177,000 | $29,200 | $147,800 |
Source: Public Records
Map
Nearby Homes