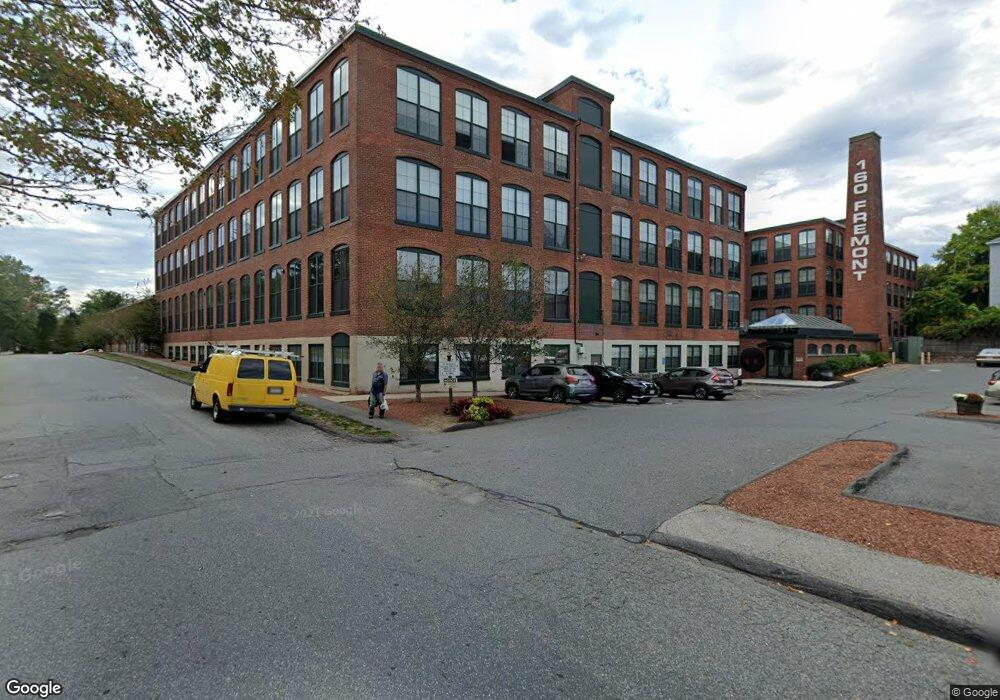
Fremont Lofts 160 Fremont St Unit 233 Worcester, MA 01603
South Worcester NeighborhoodEstimated Value: $236,000 - $252,000
1
Bed
1
Bath
845
Sq Ft
$288/Sq Ft
Est. Value
About This Home
This home is located at 160 Fremont St Unit 233, Worcester, MA 01603 and is currently estimated at $242,965, approximately $287 per square foot. 160 Fremont St Unit 233 is a home located in Worcester County with nearby schools including Jacob Hiatt Magnet School, Chandler Magnet, and University Park Campus School.
Ownership History
Date
Name
Owned For
Owner Type
Purchase Details
Closed on
May 23, 2022
Sold by
Bukhari Muhammad
Bought by
Mujeeb Hamayon
Current Estimated Value
Home Financials for this Owner
Home Financials are based on the most recent Mortgage that was taken out on this home.
Original Mortgage
$156,000
Outstanding Balance
$145,739
Interest Rate
3.75%
Mortgage Type
Adjustable Rate Mortgage/ARM
Estimated Equity
$97,226
Purchase Details
Closed on
Mar 31, 2006
Sold by
160 Fremont St Assoc L
Bought by
Mujeeb Hamayon and Bukhari Muhammad
Home Financials for this Owner
Home Financials are based on the most recent Mortgage that was taken out on this home.
Original Mortgage
$111,200
Interest Rate
6.32%
Mortgage Type
Purchase Money Mortgage
Create a Home Valuation Report for This Property
The Home Valuation Report is an in-depth analysis detailing your home's value as well as a comparison with similar homes in the area
Home Values in the Area
Average Home Value in this Area
Purchase History
| Date | Buyer | Sale Price | Title Company |
|---|---|---|---|
| Mujeeb Hamayon | -- | None Available | |
| Mujeeb Hamayon | -- | None Available | |
| Mujeeb Hamayon | $151,400 | -- | |
| Mujeeb Hamayon | $151,400 | -- |
Source: Public Records
Mortgage History
| Date | Status | Borrower | Loan Amount |
|---|---|---|---|
| Open | Mujeeb Hamayon | $156,000 | |
| Closed | Mujeeb Hamayon | $156,000 | |
| Previous Owner | Mujeeb Hamayon | $111,200 |
Source: Public Records
Tax History Compared to Growth
Tax History
| Year | Tax Paid | Tax Assessment Tax Assessment Total Assessment is a certain percentage of the fair market value that is determined by local assessors to be the total taxable value of land and additions on the property. | Land | Improvement |
|---|---|---|---|---|
| 2025 | $2,736 | $207,400 | $0 | $207,400 |
| 2024 | $2,614 | $190,100 | $0 | $190,100 |
| 2023 | $2,329 | $162,400 | $0 | $162,400 |
| 2022 | $2,050 | $134,800 | $0 | $134,800 |
| 2021 | $2,133 | $131,000 | $0 | $131,000 |
| 2020 | $1,839 | $108,200 | $0 | $108,200 |
| 2019 | $1,838 | $102,100 | $0 | $102,100 |
| 2018 | $1,747 | $92,400 | $0 | $92,400 |
| 2017 | $1,849 | $96,200 | $0 | $96,200 |
| 2016 | $1,983 | $96,200 | $0 | $96,200 |
| 2015 | $1,931 | $96,200 | $0 | $96,200 |
| 2014 | $1,880 | $96,200 | $0 | $96,200 |
Source: Public Records
About Fremont Lofts
Map
Nearby Homes
- 160 Fremont St Unit 204
- 141 Cambridge St
- 56 Richards St
- 54 Richards St
- 52 Richards St
- 103 Illinois St
- 24 Litchfield St
- 21 Hitchcock Rd
- 28 Richards St
- 12 Stoneland Rd
- 180 Canterbury St
- 5 Stoneland Rd
- 5 Freeland Terrace
- 31 Camp St
- 1022 Main St
- 21 Illinois St Unit 508
- 14 Douglas Ct
- 10 Douglas Ct
- 21 Clement St
- 120 Grand St
- 160 Fremont St Unit 422
- 160 Fremont St Unit 421
- 160 Fremont St Unit 420
- 160 Fremont St Unit 419
- 160 Fremont St Unit 418
- 160 Fremont St Unit 417
- 160 Fremont St Unit 416
- 160 Fremont St Unit 415
- 160 Fremont St Unit 414
- 160 Fremont St Unit 413
- 160 Fremont St Unit 412
- 160 Fremont St Unit 411
- 160 Fremont St Unit 410
- 160 Fremont St Unit 409
- 160 Fremont St Unit 408
- 160 Fremont St Unit 407
- 160 Fremont St Unit 406
- 160 Fremont St Unit 404
- 160 Fremont St Unit 403
- 160 Fremont St Unit 402