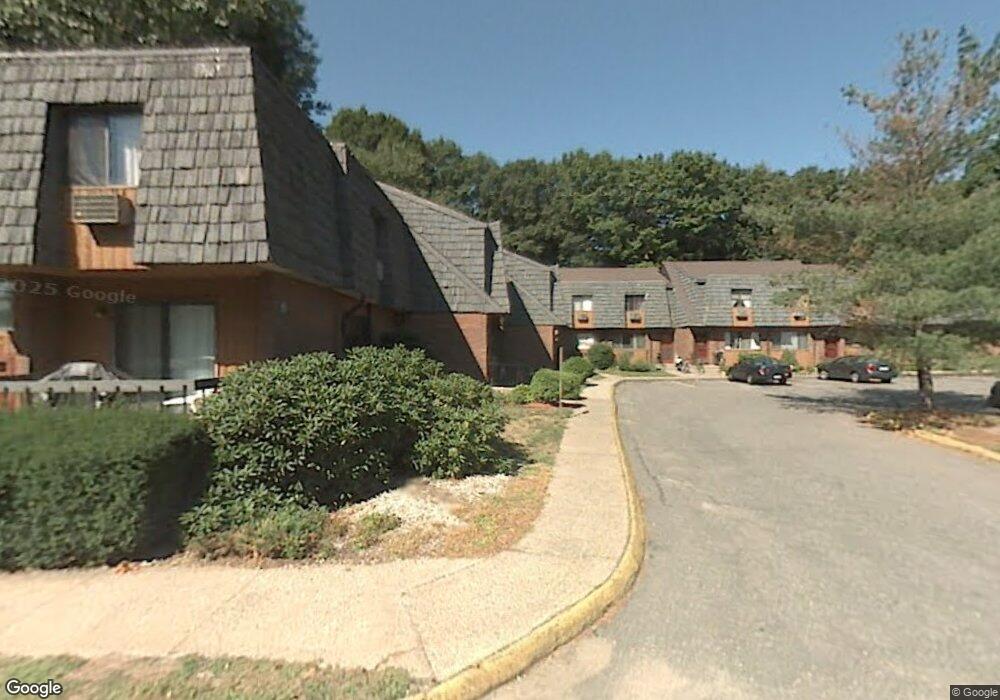
160 High Path Rd Unit 160 Windsor, CT 06095
West Windsor NeighborhoodEstimated Value: $184,000 - $194,000
2
Beds
7
Baths
1,020
Sq Ft
$186/Sq Ft
Est. Value
About This Home
This home is located at 160 High Path Rd Unit 160, Windsor, CT 06095 and is currently estimated at $189,270, approximately $185 per square foot. 160 High Path Rd Unit 160 is a home located in Hartford County with nearby schools including Oliver Ellsworth School, John F. Kennedy School, and Sage Park Middle School.
Ownership History
Date
Name
Owned For
Owner Type
Purchase Details
Closed on
Apr 28, 2010
Sold by
Hsbc Mortgage Svcs Inc
Bought by
Campbell Eileen
Current Estimated Value
Home Financials for this Owner
Home Financials are based on the most recent Mortgage that was taken out on this home.
Original Mortgage
$91,575
Outstanding Balance
$60,962
Interest Rate
4.99%
Mortgage Type
Purchase Money Mortgage
Estimated Equity
$128,308
Purchase Details
Closed on
Dec 1, 2009
Sold by
Anderson Judy and Hsbc Mortgage Svcs Inc
Bought by
Hsbc Mortgage Svcs Inc
Purchase Details
Closed on
Dec 5, 2005
Sold by
Keating Jean Ann and Keating Robert
Bought by
Anderson Judy
Home Financials for this Owner
Home Financials are based on the most recent Mortgage that was taken out on this home.
Original Mortgage
$130,000
Interest Rate
9.1%
Mortgage Type
Purchase Money Mortgage
Purchase Details
Closed on
Dec 15, 2003
Sold by
Marcin Donald
Bought by
Keating Jean and Keating Robert
Home Financials for this Owner
Home Financials are based on the most recent Mortgage that was taken out on this home.
Original Mortgage
$102,600
Interest Rate
5.9%
Mortgage Type
Purchase Money Mortgage
Create a Home Valuation Report for This Property
The Home Valuation Report is an in-depth analysis detailing your home's value as well as a comparison with similar homes in the area
Home Values in the Area
Average Home Value in this Area
Purchase History
| Date | Buyer | Sale Price | Title Company |
|---|---|---|---|
| Campbell Eileen | $95,000 | -- | |
| Hsbc Mortgage Svcs Inc | -- | -- | |
| Anderson Judy | $130,000 | -- | |
| Keating Jean | $108,000 | -- |
Source: Public Records
Mortgage History
| Date | Status | Borrower | Loan Amount |
|---|---|---|---|
| Open | Keating Jean | $91,575 | |
| Previous Owner | Keating Jean | $130,000 | |
| Previous Owner | Keating Jean | $102,600 |
Source: Public Records
Tax History
| Year | Tax Paid | Tax Assessment Tax Assessment Total Assessment is a certain percentage of the fair market value that is determined by local assessors to be the total taxable value of land and additions on the property. | Land | Improvement |
|---|---|---|---|---|
| 2025 | $2,661 | $93,520 | $0 | $93,520 |
| 2024 | $2,836 | $93,520 | $0 | $93,520 |
| 2023 | $1,957 | $58,240 | $0 | $58,240 |
| 2022 | $1,938 | $58,240 | $0 | $58,240 |
| 2021 | $1,938 | $58,240 | $0 | $58,240 |
| 2020 | $1,928 | $58,240 | $0 | $58,240 |
| 2019 | $1,886 | $58,240 | $0 | $58,240 |
| 2018 | $1,253 | $38,010 | $0 | $38,010 |
| 2017 | $1,227 | $37,800 | $0 | $37,800 |
| 2016 | $1,191 | $37,800 | $0 | $37,800 |
| 2015 | $1,169 | $37,800 | $0 | $37,800 |
| 2014 | $1,152 | $37,800 | $0 | $37,800 |
Source: Public Records
Map
Nearby Homes
- 136 High Path Rd
- 943 High Path Rd Unit 943
- 98 High Path Rd
- 268 High Path Rd Unit 268
- 106 Rockybrook
- 485 River St
- 105 Sunrise Cir
- 22 Eastview Dr
- 1 Deanne Lynn Cir
- 35 Hollow Brook Rd
- 24 Mary Catherine Cir
- 58 Hollow Brook Rd
- 490 Old Day Hill Rd
- 957 Palisado Ave
- 109 Old Village Cir
- 32 Walnut Cir
- 24 MacKtown Rd
- 5 Haskins Rd Unit 5
- 10 Cleary Ln
- 24 Coolidge St
- 160 High Path Rd
- 162 High Path Rd
- 162 High Path Rd Unit 162
- 164 High Path Rd
- 158 High Path Rd
- 166 High Path Rd
- 166 High Path Rd Unit 166
- 156 High Path Rd
- 156 High Path Rd Unit 156
- 154 High Path Rd
- 154 High Path Rd Unit 154
- 168 High Path Rd
- 152 High Path Rd
- 150 High Path Rd
- 150 High Path Rd Unit 150
- 148 High Path Rd
- 148 High Path Rd Unit 148
- 146 High Path Rd
- 146 High Path Rd Unit 146
- 142 High Path Rd
Your Personal Tour Guide
Ask me questions while you tour the home.