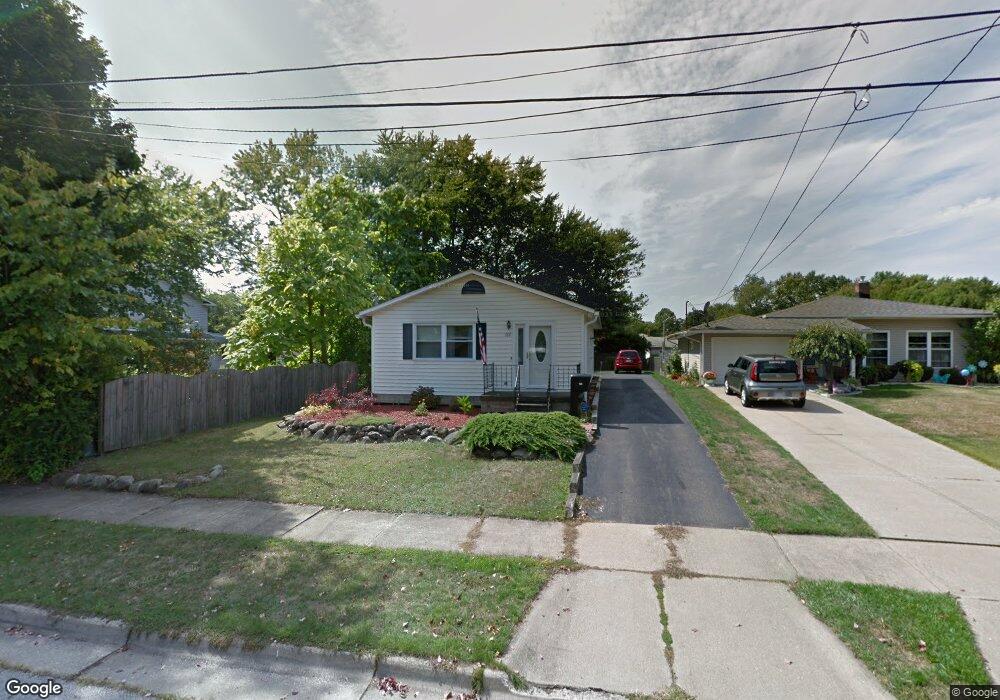
160 Hillman Rd Akron, OH 44312
Ellet NeighborhoodEstimated Value: $130,000 - $167,000
2
Beds
1
Bath
1,008
Sq Ft
$149/Sq Ft
Est. Value
About This Home
This home is located at 160 Hillman Rd, Akron, OH 44312 and is currently estimated at $150,355, approximately $149 per square foot. 160 Hillman Rd is a home located in Summit County with nearby schools including Ellet High School, Summit Academy Akron Elementary School, and Akron Preparatory school.
Ownership History
Date
Name
Owned For
Owner Type
Purchase Details
Closed on
Jan 24, 2023
Sold by
Jakob Sharon L
Bought by
Jakob Sharon L and Rush Keith A
Current Estimated Value
Home Financials for this Owner
Home Financials are based on the most recent Mortgage that was taken out on this home.
Original Mortgage
$75,000
Outstanding Balance
$72,638
Interest Rate
6.31%
Mortgage Type
New Conventional
Estimated Equity
$77,717
Purchase Details
Closed on
Jun 3, 2021
Sold by
Jakob Sharon L
Bought by
Rush Keith A
Purchase Details
Closed on
Apr 12, 2014
Sold by
Konrad Jakob Jr
Bought by
Jakob Sharon L and Jakob Konrod
Purchase Details
Closed on
Apr 30, 1999
Sold by
Konrad Jakob and Konrad Teresa M
Bought by
Jakob Konrad
Home Financials for this Owner
Home Financials are based on the most recent Mortgage that was taken out on this home.
Original Mortgage
$53,500
Interest Rate
7.04%
Create a Home Valuation Report for This Property
The Home Valuation Report is an in-depth analysis detailing your home's value as well as a comparison with similar homes in the area
Home Values in the Area
Average Home Value in this Area
Purchase History
| Date | Buyer | Sale Price | Title Company |
|---|---|---|---|
| Jakob Sharon L | -- | -- | |
| Rush Keith A | -- | None Available | |
| Jakob Sharon L | -- | None Available | |
| Jakob Konrad | -- | Affiliated Title |
Source: Public Records
Mortgage History
| Date | Status | Borrower | Loan Amount |
|---|---|---|---|
| Open | Jakob Sharon L | $75,000 | |
| Previous Owner | Jakob Konrad | $53,500 |
Source: Public Records
Tax History Compared to Growth
Tax History
| Year | Tax Paid | Tax Assessment Tax Assessment Total Assessment is a certain percentage of the fair market value that is determined by local assessors to be the total taxable value of land and additions on the property. | Land | Improvement |
|---|---|---|---|---|
| 2025 | $1,956 | $45,563 | $8,379 | $37,184 |
| 2024 | $1,956 | $45,563 | $8,379 | $37,184 |
| 2023 | $1,956 | $45,563 | $8,379 | $37,184 |
| 2022 | $1,754 | $34,258 | $6,300 | $27,958 |
| 2021 | $1,756 | $34,258 | $6,300 | $27,958 |
| 2020 | $1,730 | $34,260 | $6,300 | $27,960 |
| 2019 | $1,803 | $32,970 | $5,990 | $26,980 |
| 2018 | $2,388 | $32,970 | $5,990 | $26,980 |
| 2017 | $2,138 | $32,970 | $5,990 | $26,980 |
| 2016 | $2,140 | $28,890 | $5,990 | $22,900 |
| 2015 | $2,138 | $28,890 | $5,990 | $22,900 |
| 2014 | $2,121 | $28,890 | $5,990 | $22,900 |
| 2013 | $2,083 | $28,970 | $5,990 | $22,980 |
Source: Public Records
Map
Nearby Homes
- 159 Dellenberger Ave
- 198 Hilbish Ave
- 181 Hilbish Ave
- 274 Fulmer Ave
- 195 Prairie Dr
- 1835 Penthley Ave
- 57 Carlton Dr
- 364 Stanley Rd
- 1955 Preston Ave Unit 1957
- 1826 Ford Ave
- 1947 Preston Ave Unit 1949
- 427 Fulmer Ave
- 1818 Flint Ave
- 1874 Adelaide Blvd
- 172 Emmons Ave
- 406 Baldwin Rd
- 452 Herbert Rd
- 1769 Flint Ave
- 2258 Mogadore Rd
- 490 Stephens Rd
- 156 Hillman Rd
- 170 Hillman Rd
- 150 Hillman Rd
- 165 Stephens Rd
- 161 Stephens Rd
- 171 Stephens Rd
- 176 Hillman Rd
- 155 Stephens Rd
- 159 Hillman Rd
- 165 Hillman Rd
- 155 Hillman Rd
- 1969 Cramer Ave
- 140 Hillman Rd
- 168 Hillman Rd
- 1955 Cramer Ave
- 151 Stephens Rd
- 149 Hillman Rd
- 169 Hillman Rd
- 145 Stephens Rd
- 136 Hillman Rd