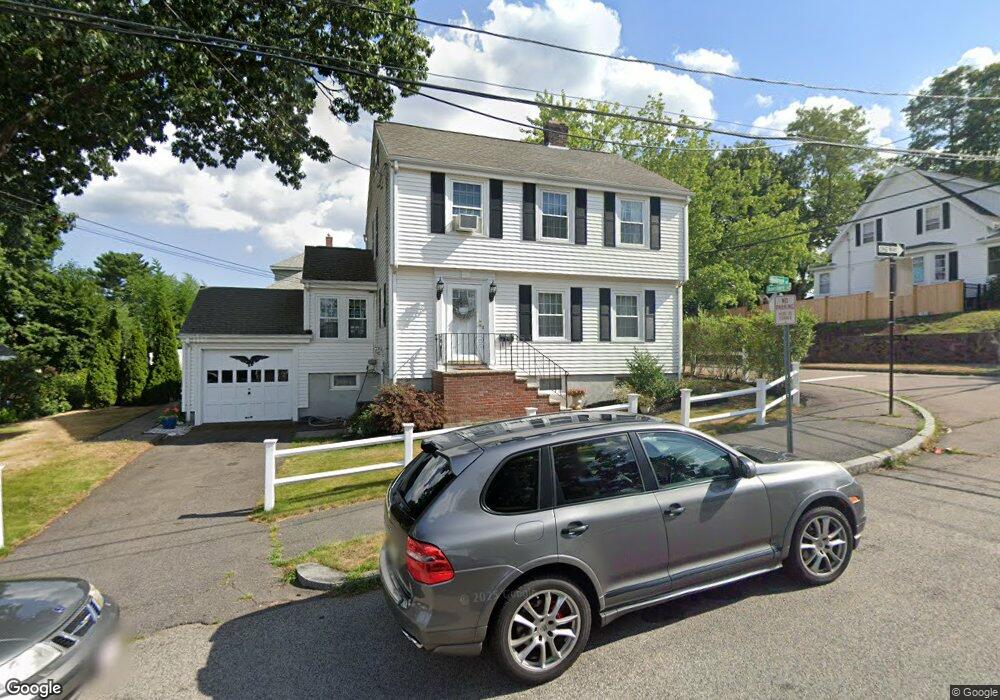
160 Holbrook Rd Quincy, MA 02171
Montclair NeighborhoodEstimated Value: $699,000 - $722,000
3
Beds
2
Baths
1,554
Sq Ft
$458/Sq Ft
Est. Value
About This Home
This home is located at 160 Holbrook Rd, Quincy, MA 02171 and is currently estimated at $712,484, approximately $458 per square foot. 160 Holbrook Rd is a home located in Norfolk County with nearby schools including Montclair Elementary School, Atlantic Middle School, and North Quincy High School.
Ownership History
Date
Name
Owned For
Owner Type
Purchase Details
Closed on
Feb 17, 1989
Sold by
Maibach Lawrence E
Bought by
Curran James
Current Estimated Value
Home Financials for this Owner
Home Financials are based on the most recent Mortgage that was taken out on this home.
Original Mortgage
$148,000
Interest Rate
10.77%
Mortgage Type
Purchase Money Mortgage
Create a Home Valuation Report for This Property
The Home Valuation Report is an in-depth analysis detailing your home's value as well as a comparison with similar homes in the area
Home Values in the Area
Average Home Value in this Area
Purchase History
| Date | Buyer | Sale Price | Title Company |
|---|---|---|---|
| Curran James | $148,000 | -- |
Source: Public Records
Mortgage History
| Date | Status | Borrower | Loan Amount |
|---|---|---|---|
| Closed | Curran James | $148,000 |
Source: Public Records
Tax History
| Year | Tax Paid | Tax Assessment Tax Assessment Total Assessment is a certain percentage of the fair market value that is determined by local assessors to be the total taxable value of land and additions on the property. | Land | Improvement |
|---|---|---|---|---|
| 2025 | $7,637 | $662,400 | $330,300 | $332,100 |
| 2024 | $7,391 | $655,800 | $330,300 | $325,500 |
| 2023 | $6,872 | $617,400 | $314,600 | $302,800 |
| 2022 | $6,669 | $556,700 | $273,500 | $283,200 |
| 2021 | $6,474 | $533,300 | $260,500 | $272,800 |
| 2020 | $6,241 | $502,100 | $260,500 | $241,600 |
| 2019 | $5,947 | $473,900 | $243,500 | $230,400 |
| 2018 | $5,848 | $438,400 | $225,400 | $213,000 |
| 2017 | $5,777 | $407,700 | $214,700 | $193,000 |
| 2016 | $5,272 | $367,100 | $186,700 | $180,400 |
| 2015 | $4,996 | $342,200 | $169,700 | $172,500 |
| 2014 | $4,751 | $319,700 | $161,600 | $158,100 |
Source: Public Records
Map
Nearby Homes
- 54 Safford St
- 115 W Squantum St Unit 517
- 115 W Squantum St Unit 811
- 39 Fayette St Unit 403
- 100 W Squantum St Unit 411
- 154 N Central Ave
- 30 Elmwood Park
- 17 Holmes St Unit 204
- 17 Holmes St Unit 2
- 17 Holmes St Unit 1
- 281 Elmwood Ave
- 17 Albany St
- 267-269 Farrington St
- 0 Franklin St
- 10 Weston Ave Unit 322
- 85 Myrtle St Unit 106
- 70 Walnut St
- 52 California Ave
- 85 E Squantum St Unit 10
- 20 Ellington Rd
- 30 Amesbury St
- 156 Holbrook Rd
- 152 Holbrook Rd
- 170 Holbrook Rd
- 32 Amesbury St
- 161 Holbrook Rd
- 157 Holbrook Rd
- 150 Holbrook Rd
- 31 Amesbury St
- 176 Holbrook Rd
- 71 Elliot Ave
- 167 Holbrook Rd
- 59 Elliot Ave
- 147 Holbrook Rd
- 65 Elliot Ave
- 144 Holbrook Rd
- 33 Amesbury St
- 55 Elliot Ave
- 175 Holbrook Rd Unit 2
- 175 Holbrook Rd Unit 1
Your Personal Tour Guide
Ask me questions while you tour the home.