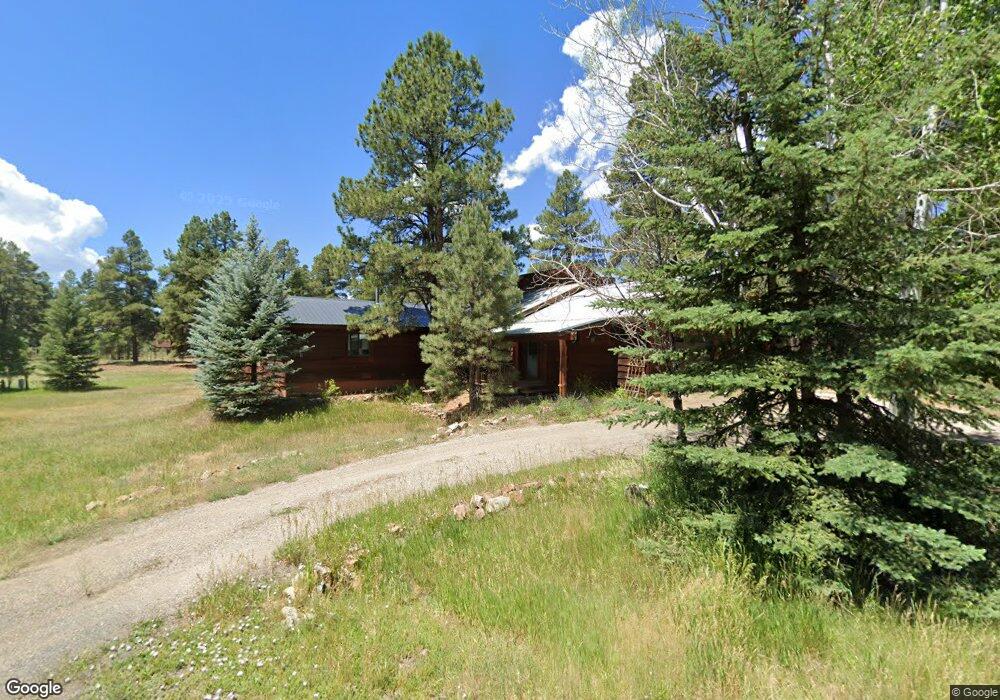
160 Inspiration Dr Pagosa Springs, CO 81147
Estimated Value: $575,000 - $662,000
3
Beds
3
Baths
1,736
Sq Ft
$351/Sq Ft
Est. Value
About This Home
This home is located at 160 Inspiration Dr, Pagosa Springs, CO 81147 and is currently estimated at $608,722, approximately $350 per square foot. 160 Inspiration Dr is a home located in Archuleta County with nearby schools including Pagosa Springs Elementary School, Pagosa Springs Middle School, and Pagosa Springs High School.
Ownership History
Date
Name
Owned For
Owner Type
Purchase Details
Closed on
Jun 12, 2012
Sold by
Shewbridge Carole and Dippel Tim
Bought by
Dippel Timothy Paul and Dippel Rose Sequoia
Current Estimated Value
Purchase Details
Closed on
Apr 24, 1997
Sold by
Ormonde Todd and Ormonde Luann
Bought by
Shewbridge Carol and Dippel Tim
Purchase Details
Closed on
Oct 9, 1996
Sold by
Boddy Mary L
Bought by
Ormonde Todd and Ormonde Luann
Purchase Details
Closed on
Aug 16, 1996
Sold by
Snavely John A and Snavely Joanne
Bought by
Dippel Tim and Shewbridge Carole
Purchase Details
Closed on
Dec 7, 1993
Sold by
Boddy Richard E and Boddy Mary L
Bought by
Boddy Mary L
Purchase Details
Closed on
Dec 21, 1992
Sold by
Scarborugh Frankie E
Bought by
Snavely John A and Snavely Joanne
Purchase Details
Closed on
May 10, 1986
Sold by
Fpi
Bought by
Boddy Richard and Boddy Mary
Purchase Details
Closed on
Jul 3, 1972
Sold by
Eic
Bought by
Scarborough Oscar L
Create a Home Valuation Report for This Property
The Home Valuation Report is an in-depth analysis detailing your home's value as well as a comparison with similar homes in the area
Home Values in the Area
Average Home Value in this Area
Purchase History
| Date | Buyer | Sale Price | Title Company |
|---|---|---|---|
| Dippel Timothy Paul | -- | None Available | |
| Shewbridge Carol | $8,500 | -- | |
| Ormonde Todd | $7,000 | -- | |
| Dippel Tim | $115,000 | -- | |
| Boddy Mary L | -- | -- | |
| Snavely John A | $3,000 | -- | |
| Boddy Richard | $9,700 | -- | |
| Scarborough Oscar L | $6,100 | -- |
Source: Public Records
Tax History Compared to Growth
Tax History
| Year | Tax Paid | Tax Assessment Tax Assessment Total Assessment is a certain percentage of the fair market value that is determined by local assessors to be the total taxable value of land and additions on the property. | Land | Improvement |
|---|---|---|---|---|
| 2024 | $2,254 | $37,190 | $4,430 | $32,760 |
| 2023 | $2,254 | $37,190 | $4,430 | $32,760 |
| 2022 | $1,654 | $25,440 | $2,620 | $22,820 |
| 2021 | $1,792 | $26,160 | $2,690 | $23,470 |
| 2020 | $1,678 | $24,110 | $2,690 | $21,420 |
| 2019 | $1,656 | $24,110 | $2,690 | $21,420 |
| 2018 | $1,417 | $18,790 | $2,100 | $16,690 |
| 2017 | $1,242 | $18,790 | $2,100 | $16,690 |
| 2016 | $1,042 | $15,560 | $2,470 | $13,090 |
| 2015 | -- | $15,560 | $2,470 | $13,090 |
| 2014 | -- | $11,610 | $960 | $10,650 |
Source: Public Records
Map
Nearby Homes
- 1288 Antelope Ave
- 1338 Antelope Ave
- 81 Oxbow Cir
- 1520 Antelope Ave
- 77 Fisher Ct
- 698 Monument Ave
- 1318 Cloud Cap Ave
- 46 Carefree Place
- 44 Monument Ave
- 824 Antelope
- 240 Glade Dr
- 12 Monument Ave
- 29 Monument Ave
- 165 Butte Dr
- 233 Sweetwater Dr
- 151 Butte Dr
- 95 Enchanted Place
- 142 Capitan Cir
- 18 Balfour Ct
- 57 Garnet Ct
- 188 Inspiration Dr
- 161 Inspiration Dr
- 130 Inspiration Dr
- 181 Inspiration Dr
- 118 Inspiration Dr
- 203 Inspiration Dr
- 0 Inspiration Dr
- 275 Oxbow Cir
- 121 Inspiration Dr
- 914 Cloud Cap Ave
- 908 Cloud Cap Ave
- 918 Cloud Cap Ave
- 930 Cloud Cap Ave
- 97 Inspiration Dr
- 218 Inspiration Dr
- 878 Cloud Cap Ave
- 349 Oxbow Cir
- 904 Cloud Cap Ave
- 898 Cloud Cap Ave
- 922 Cloud Cap Ave