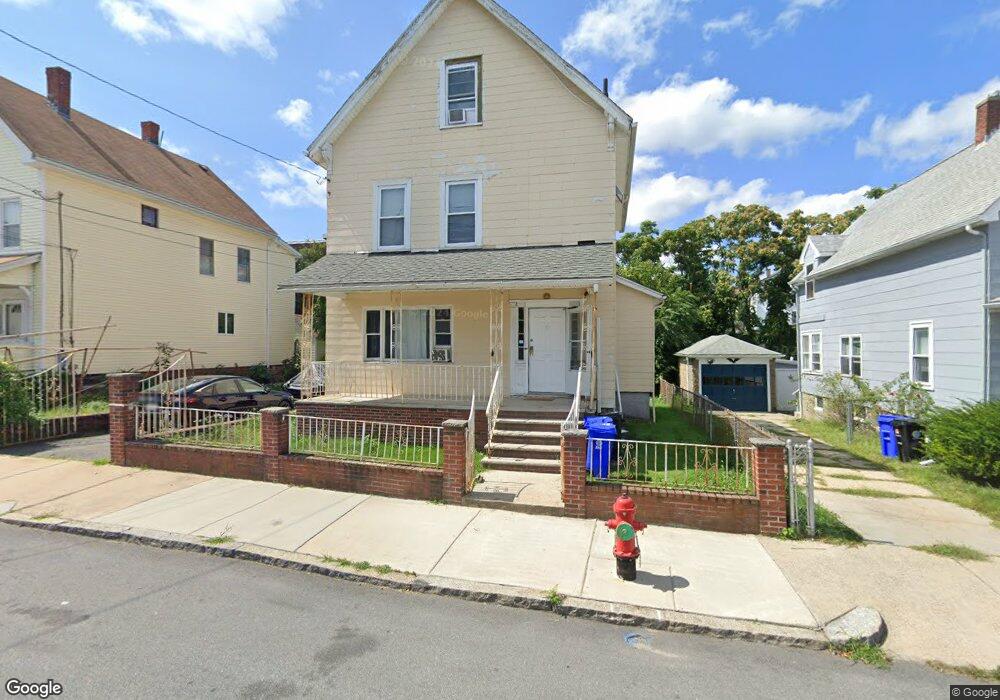
160 Linden Ave Malden, MA 02148
Oak Grove NeighborhoodEstimated Value: $632,000 - $850,000
6
Beds
2
Baths
2,632
Sq Ft
$287/Sq Ft
Est. Value
About This Home
This home is located at 160 Linden Ave, Malden, MA 02148 and is currently estimated at $755,444, approximately $287 per square foot. 160 Linden Ave is a home located in Middlesex County with nearby schools including Malden High School, Mystic Valley Regional Charter School, and Cheverus Catholic School.
Ownership History
Date
Name
Owned For
Owner Type
Purchase Details
Closed on
Mar 1, 2002
Sold by
Long Andy
Bought by
Zeng Qing Qiao
Current Estimated Value
Home Financials for this Owner
Home Financials are based on the most recent Mortgage that was taken out on this home.
Original Mortgage
$160,000
Outstanding Balance
$65,848
Interest Rate
6.85%
Mortgage Type
Purchase Money Mortgage
Estimated Equity
$689,596
Purchase Details
Closed on
Oct 13, 1998
Sold by
Mei Xiu Ting
Bought by
Long Andy
Home Financials for this Owner
Home Financials are based on the most recent Mortgage that was taken out on this home.
Original Mortgage
$134,400
Interest Rate
6.92%
Mortgage Type
Purchase Money Mortgage
Purchase Details
Closed on
Nov 7, 1988
Sold by
Tecce Luigi
Bought by
Tang Yiu Lam
Create a Home Valuation Report for This Property
The Home Valuation Report is an in-depth analysis detailing your home's value as well as a comparison with similar homes in the area
Home Values in the Area
Average Home Value in this Area
Purchase History
| Date | Buyer | Sale Price | Title Company |
|---|---|---|---|
| Zeng Qing Qiao | $200,000 | -- | |
| Long Andy | $168,000 | -- | |
| Long Andy | $168,000 | -- | |
| Tang Yiu Lam | $172,000 | -- |
Source: Public Records
Mortgage History
| Date | Status | Borrower | Loan Amount |
|---|---|---|---|
| Open | Tang Yiu Lam | $160,000 | |
| Previous Owner | Tang Yiu Lam | $134,400 | |
| Previous Owner | Tang Yiu Lam | $100,000 |
Source: Public Records
Tax History Compared to Growth
Tax History
| Year | Tax Paid | Tax Assessment Tax Assessment Total Assessment is a certain percentage of the fair market value that is determined by local assessors to be the total taxable value of land and additions on the property. | Land | Improvement |
|---|---|---|---|---|
| 2025 | $74 | $649,700 | $294,900 | $354,800 |
| 2024 | $7,079 | $605,600 | $278,500 | $327,100 |
| 2023 | $6,857 | $562,500 | $253,900 | $308,600 |
| 2022 | $6,543 | $529,800 | $229,300 | $300,500 |
| 2021 | $7,477 | $608,400 | $204,800 | $403,600 |
| 2020 | $7,427 | $587,100 | $197,800 | $389,300 |
| 2019 | $6,701 | $505,000 | $188,400 | $316,600 |
| 2018 | $6,472 | $459,300 | $155,600 | $303,700 |
| 2017 | $6,300 | $444,600 | $149,500 | $295,100 |
| 2016 | $6,100 | $402,400 | $137,200 | $265,200 |
| 2015 | $6,091 | $387,200 | $130,600 | $256,600 |
| 2014 | $5,770 | $358,400 | $118,800 | $239,600 |
Source: Public Records
Map
Nearby Homes
- 55 Vernon St
- 131 Linden Ave
- 20 Washington Place
- 29 Lincoln St
- 41 Mountain Ave
- 23 Orient St
- 14 Holm Ct Unit 2
- 1 Glenwood St Unit 3
- 1 Glenwood St Unit 4
- 1 Glenwood St Unit 5
- 20 Rockland Ave Unit 3
- 91-93 Beltran St
- 20 Chestnut St Unit 205
- 11-13 Hudson St
- 197 Clifton St Unit 4
- 87 Cedar St Unit 10
- 53 Maple St
- 43 Park St
- 921 Main St
- 38 Greystone Rd
- 170 Linden Ave
- 164 Linden Ave
- 168 Linden Ave
- 156 Linden Ave
- 152 Linden Ave
- 152 Linden Ave Unit 1
- 155 Linden Ave
- 155 Linden Ave Unit 2
- 155 Linden Ave Unit 1
- 91 Clifton St
- 163 Linden Ave
- 95 Clifton St Unit 306
- 95 Clifton St Unit 305
- 95 Clifton St Unit 304
- 95 Clifton St Unit 303
- 95 Clifton St Unit 302
- 95 Clifton St Unit 301
- 95 Clifton St Unit L3
- 95 Clifton St Unit 206
- 95 Clifton St Unit 205