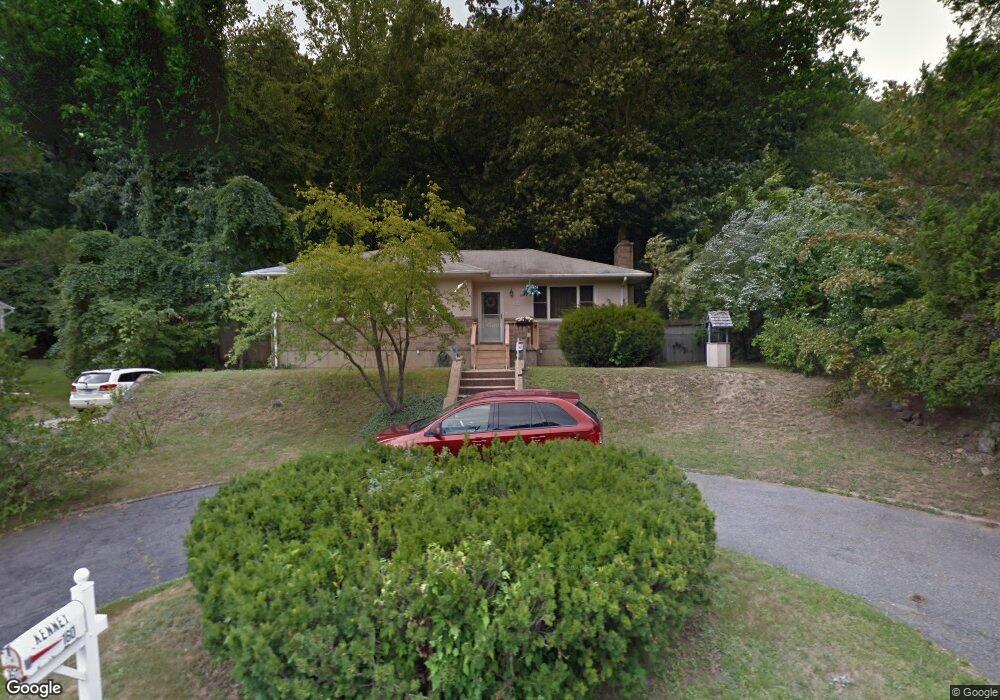
160 Malcolm Rd West Haven, CT 06516
Allingtown NeighborhoodEstimated Value: $244,000 - $353,730
3
Beds
3
Baths
1,180
Sq Ft
$266/Sq Ft
Est. Value
About This Home
This home is located at 160 Malcolm Rd, West Haven, CT 06516 and is currently estimated at $314,183, approximately $266 per square foot. 160 Malcolm Rd is a home located in New Haven County with nearby schools including Carrigan 5/6 Intermediate School, Harry M. Bailey Middle School, and West Haven High School.
Ownership History
Date
Name
Owned For
Owner Type
Purchase Details
Closed on
Mar 10, 2000
Sold by
Fnma
Bought by
Kenney John and Kenney Charlene
Current Estimated Value
Purchase Details
Closed on
May 29, 1996
Sold by
Robinson Bernard J and Robinson Joyce A
Bought by
Mack Steven and Mack Herbie
Create a Home Valuation Report for This Property
The Home Valuation Report is an in-depth analysis detailing your home's value as well as a comparison with similar homes in the area
Home Values in the Area
Average Home Value in this Area
Purchase History
| Date | Buyer | Sale Price | Title Company |
|---|---|---|---|
| Kenney John | $76,900 | -- | |
| Mack Steven | $125,000 | -- | |
| Kenney John | $76,900 | -- | |
| Mack Steven | $125,000 | -- |
Source: Public Records
Mortgage History
| Date | Status | Borrower | Loan Amount |
|---|---|---|---|
| Open | Mack Steven | $146,015 | |
| Closed | Mack Steven | $147,000 | |
| Closed | Mack Steven | $108,000 |
Source: Public Records
Tax History
| Year | Tax Paid | Tax Assessment Tax Assessment Total Assessment is a certain percentage of the fair market value that is determined by local assessors to be the total taxable value of land and additions on the property. | Land | Improvement |
|---|---|---|---|---|
| 2025 | $7,699 | $226,380 | $70,210 | $156,170 |
| 2024 | $6,269 | $130,900 | $48,650 | $82,250 |
| 2023 | $6,076 | $130,900 | $48,650 | $82,250 |
| 2022 | $5,970 | $130,900 | $48,650 | $82,250 |
| 2021 | $5,972 | $130,900 | $48,650 | $82,250 |
| 2020 | $7,827 | $115,710 | $40,740 | $74,970 |
| 2019 | $5,866 | $115,710 | $40,740 | $74,970 |
| 2018 | $5,707 | $115,710 | $40,740 | $74,970 |
| 2017 | $7,569 | $115,710 | $40,740 | $74,970 |
| 2016 | $5,361 | $115,710 | $40,740 | $74,970 |
| 2015 | $5,101 | $125,370 | $43,190 | $82,180 |
| 2014 | $5,000 | $125,370 | $43,190 | $82,180 |
Source: Public Records
Map
Nearby Homes
- 108 Rockdale Rd
- 38 Chauncey St
- 37 Yates St
- 110 Fenwick St
- 127 Rangely St
- 48 Trescott St
- 45 Daytona St
- 82 Hemlock St
- 46 Ogden St
- 9 Sanford St
- 3 Vernon St
- 116 Lee St
- 76 Westfield St
- 61 Hillside St
- 48 Homeside Ave Unit 4
- 11 Edna St
- 36 Westfield St
- 229 Homeside Ave
- 15 Crest St Unit C15
- 309 Terrace Ave Unit 44
Your Personal Tour Guide
Ask me questions while you tour the home.