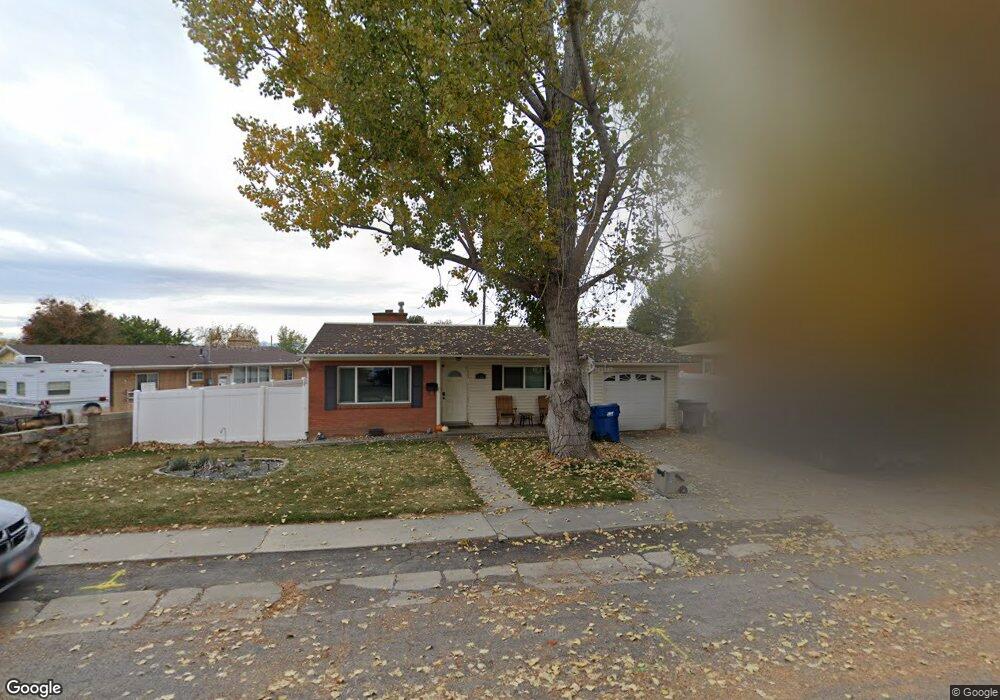
160 Maple Ln Pleasant Grove, UT 84062
Estimated Value: $411,000 - $449,118
3
Beds
1
Bath
1,880
Sq Ft
$226/Sq Ft
Est. Value
About This Home
This home is located at 160 Maple Ln, Pleasant Grove, UT 84062 and is currently estimated at $425,706, approximately $226 per square foot. 160 Maple Ln is a home located in Utah County with nearby schools including Mount Mahogany School, Pleasant Grove Junior High School, and Pleasant Grove High School.
Ownership History
Date
Name
Owned For
Owner Type
Purchase Details
Closed on
Apr 9, 2004
Sold by
Lamoreaux J W Craig
Bought by
Lamoreaux Sandra
Current Estimated Value
Purchase Details
Closed on
Apr 8, 2004
Sold by
Lamoreaux Jennifer
Bought by
Lamoreaux Sandra
Purchase Details
Closed on
Apr 7, 2004
Sold by
Lamoreaux Sandra and Lamoreaux Lisa Ann
Bought by
Lamoreaux Sandra
Purchase Details
Closed on
Mar 29, 2001
Sold by
Lacey Daniel Keith and Baker Edwenia Sue
Bought by
Lewis James H and Lewis Heather L
Home Financials for this Owner
Home Financials are based on the most recent Mortgage that was taken out on this home.
Original Mortgage
$112,238
Outstanding Balance
$41,498
Interest Rate
7.06%
Mortgage Type
FHA
Estimated Equity
$384,208
Create a Home Valuation Report for This Property
The Home Valuation Report is an in-depth analysis detailing your home's value as well as a comparison with similar homes in the area
Home Values in the Area
Average Home Value in this Area
Purchase History
| Date | Buyer | Sale Price | Title Company |
|---|---|---|---|
| Lamoreaux Sandra | -- | Inwest Title Services Inc | |
| Lamoreaux Sandra | -- | Inwest Title Services Inc | |
| Lamoreaux Sandra | -- | Inwest Title Services Inc | |
| Lewis James H | -- | Equity Title Agency Inc |
Source: Public Records
Mortgage History
| Date | Status | Borrower | Loan Amount |
|---|---|---|---|
| Open | Lewis James H | $112,238 |
Source: Public Records
Tax History
| Year | Tax Paid | Tax Assessment Tax Assessment Total Assessment is a certain percentage of the fair market value that is determined by local assessors to be the total taxable value of land and additions on the property. | Land | Improvement |
|---|---|---|---|---|
| 2025 | $1,596 | $206,030 | -- | -- |
| 2024 | $1,596 | $190,410 | $0 | $0 |
| 2023 | $1,552 | $189,640 | $0 | $0 |
| 2022 | $1,771 | $215,270 | $0 | $0 |
| 2021 | $1,528 | $282,800 | $131,400 | $151,400 |
| 2020 | $1,405 | $254,900 | $117,300 | $137,600 |
| 2019 | $1,235 | $231,700 | $107,800 | $123,900 |
| 2018 | $1,186 | $210,400 | $98,300 | $112,100 |
| 2017 | $1,047 | $98,945 | $0 | $0 |
| 2016 | $1,018 | $92,840 | $0 | $0 |
| 2015 | $1,075 | $92,840 | $0 | $0 |
| 2014 | $990 | $84,700 | $0 | $0 |
Source: Public Records
Map
Nearby Homes
- 412 S 350 E
- 435 E 790 S Unit 8
- 494 E Apple Blossom Dr
- 165 S 200 E
- 190 E 100 S
- 35 S 100 E
- 46 S 100 W Unit 1
- 696 S Locust Ave
- 77 N Main St
- 590 N Buffalo Grass Ln
- 588 N Buffalo Grass Ln
- 582 N Buffalo Grass Ln
- 578 N Buffalo Grass Ln
- 572 N Buffalo Grass Ln
- 576 N Buffalo Grass Ln
- 570 N Buffalo Grass Ln
- 574 N Buffalo Grass Ln
- 568 N Buffalo Grass Ln
- 566 N Buffalo Grass Ln
- 564 N Buffalo Grass Ln Unit 1250
Your Personal Tour Guide
Ask me questions while you tour the home.