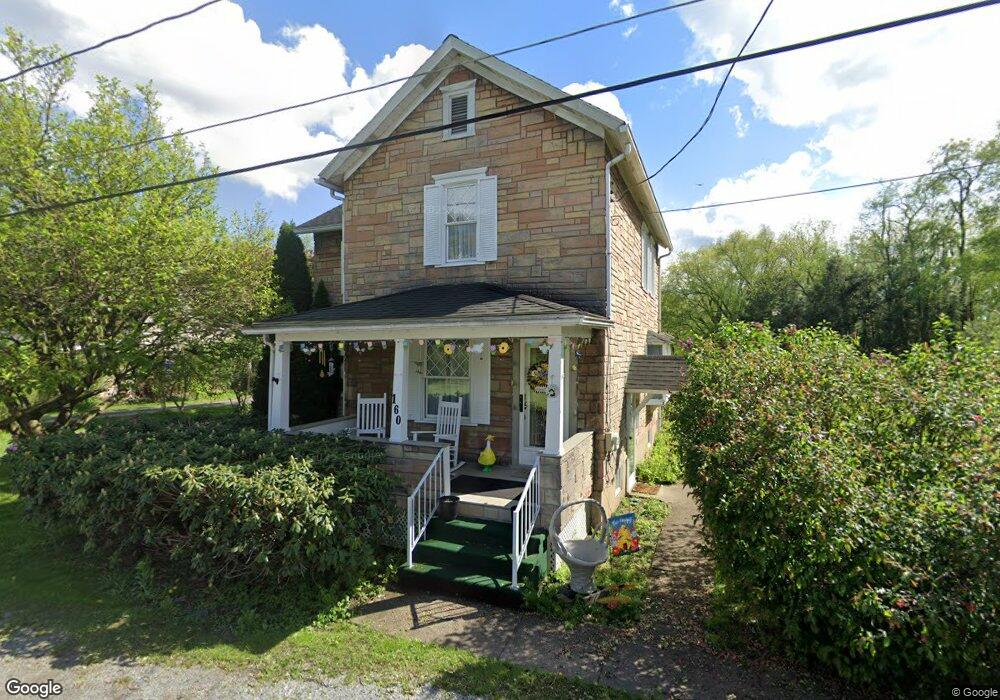
160 Mazza St Homer City, PA 15748
Estimated Value: $102,000 - $143,249
3
Beds
2
Baths
1,712
Sq Ft
$72/Sq Ft
Est. Value
About This Home
This home is located at 160 Mazza St, Homer City, PA 15748 and is currently estimated at $124,062, approximately $72 per square foot. 160 Mazza St is a home located in Indiana County with nearby schools including Homer-Center Elementary School and Homer-Center Junior/Senior High School.
Ownership History
Date
Name
Owned For
Owner Type
Purchase Details
Closed on
Oct 18, 2024
Sold by
Thomas F Boske F and Thomas Joan E
Bought by
Buchner David J and Boske Leah M
Current Estimated Value
Home Financials for this Owner
Home Financials are based on the most recent Mortgage that was taken out on this home.
Original Mortgage
$82,400
Outstanding Balance
$81,534
Interest Rate
6.35%
Mortgage Type
New Conventional
Estimated Equity
$42,528
Purchase Details
Closed on
Sep 21, 2005
Sold by
Boske Thomas F and Boske Joan E
Bought by
Boske Thomas F and Boske Joan E
Purchase Details
Closed on
Jun 15, 2005
Sold by
Boske Thomas F and Boske Joan E
Bought by
Abel Doris Jean
Create a Home Valuation Report for This Property
The Home Valuation Report is an in-depth analysis detailing your home's value as well as a comparison with similar homes in the area
Home Values in the Area
Average Home Value in this Area
Purchase History
| Date | Buyer | Sale Price | Title Company |
|---|---|---|---|
| Buchner David J | $103,000 | None Listed On Document | |
| Boske Thomas F | -- | None Available | |
| Abel Doris Jean | -- | None Available |
Source: Public Records
Mortgage History
| Date | Status | Borrower | Loan Amount |
|---|---|---|---|
| Open | Buchner David J | $82,400 |
Source: Public Records
Tax History Compared to Growth
Tax History
| Year | Tax Paid | Tax Assessment Tax Assessment Total Assessment is a certain percentage of the fair market value that is determined by local assessors to be the total taxable value of land and additions on the property. | Land | Improvement |
|---|---|---|---|---|
| 2025 | $1,769 | $70,600 | $11,400 | $59,200 |
| 2024 | $1,741 | $70,600 | $11,400 | $59,200 |
| 2023 | $1,637 | $70,600 | $11,400 | $59,200 |
| 2022 | $1,620 | $70,600 | $11,400 | $59,200 |
| 2021 | $1,620 | $70,600 | $11,400 | $59,200 |
| 2020 | $1,587 | $70,600 | $11,400 | $59,200 |
| 2018 | $1,568 | $70,600 | $11,400 | $59,200 |
| 2017 | $1,286 | $70,600 | $11,400 | $59,200 |
| 2016 | -- | $70,600 | $11,400 | $59,200 |
| 2015 | -- | $9,040 | $780 | $8,260 |
| 2014 | -- | $9,080 | $780 | $8,300 |
Source: Public Records
Map
Nearby Homes