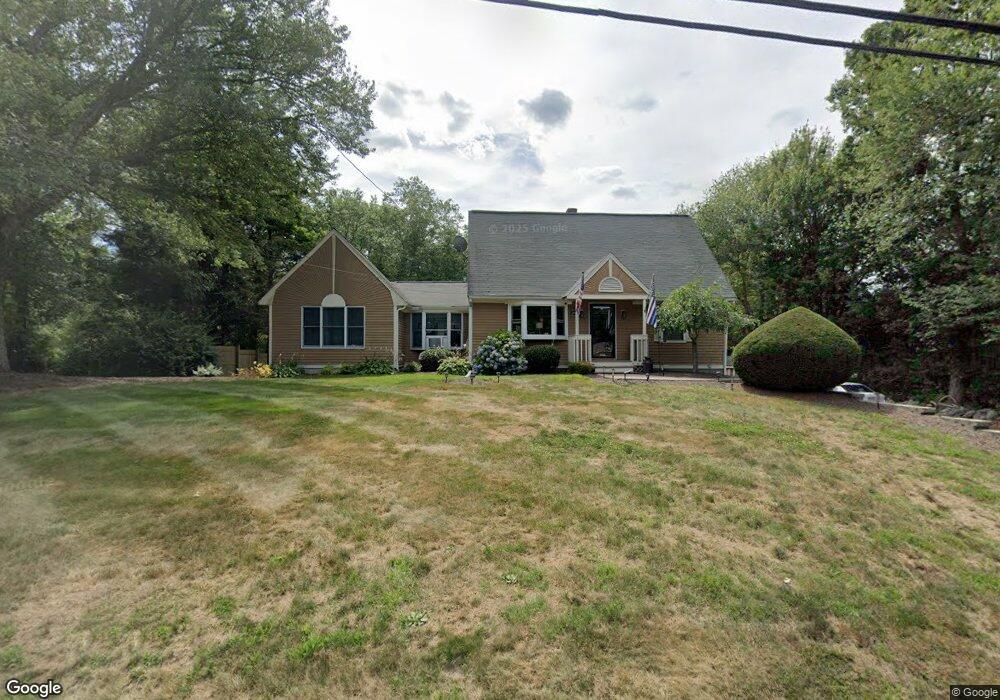
160 Moulton St Rehoboth, MA 02769
Estimated Value: $553,455 - $669,000
2
Beds
2
Baths
2,075
Sq Ft
$291/Sq Ft
Est. Value
About This Home
This home is located at 160 Moulton St, Rehoboth, MA 02769 and is currently estimated at $603,114, approximately $290 per square foot. 160 Moulton St is a home located in Bristol County with nearby schools including Dighton-Rehoboth Regional High School and Cedar Brook School.
Ownership History
Date
Name
Owned For
Owner Type
Purchase Details
Closed on
Oct 30, 2023
Sold by
Wetherell Marcia J
Bought by
Wetherell Marcia J and Wetherell Mark
Current Estimated Value
Purchase Details
Closed on
Apr 9, 2008
Sold by
Wetherell Dale R and Wetherell Marcia J
Bought by
Wetherell Marcia J
Create a Home Valuation Report for This Property
The Home Valuation Report is an in-depth analysis detailing your home's value as well as a comparison with similar homes in the area
Home Values in the Area
Average Home Value in this Area
Purchase History
| Date | Buyer | Sale Price | Title Company |
|---|---|---|---|
| Wetherell Marcia J | -- | None Available | |
| Wetherell Marcia J | -- | -- |
Source: Public Records
Tax History Compared to Growth
Tax History
| Year | Tax Paid | Tax Assessment Tax Assessment Total Assessment is a certain percentage of the fair market value that is determined by local assessors to be the total taxable value of land and additions on the property. | Land | Improvement |
|---|---|---|---|---|
| 2025 | $4,634 | $415,600 | $154,500 | $261,100 |
| 2024 | $4,280 | $376,800 | $154,500 | $222,300 |
| 2023 | $4,286 | $370,100 | $151,500 | $218,600 |
| 2022 | $4,033 | $318,300 | $151,500 | $166,800 |
| 2021 | $4,118 | $311,000 | $144,200 | $166,800 |
| 2020 | $4,008 | $305,500 | $144,200 | $161,300 |
| 2018 | $3,396 | $278,000 | $137,400 | $140,600 |
| 2017 | $3,251 | $258,800 | $137,400 | $121,400 |
| 2016 | $3,075 | $253,100 | $137,400 | $115,700 |
| 2015 | $3,268 | $265,500 | $130,800 | $134,700 |
| 2014 | $3,106 | $249,700 | $124,600 | $125,100 |
Source: Public Records
Map
Nearby Homes
- 8 Linden Ln
- 8 Linden Ln
- 42 Linden Ln
- 14 Deborah Ann Dr Unit 41
- 63 Moulton St
- 20 School St
- 120 Plain St
- 111 Summer St
- 267 Chestnut St
- 248 County
- 198 Brook St
- 0 Winter St
- 92 Martin St
- 19 Cedar St Unit 21
- 75 Martin St
- 23 Bay State Rd
- 0 Winthrop St Unit 73180872
- 246 Winthrop St
- 225 Winthrop St
- 36 Columbine Rd