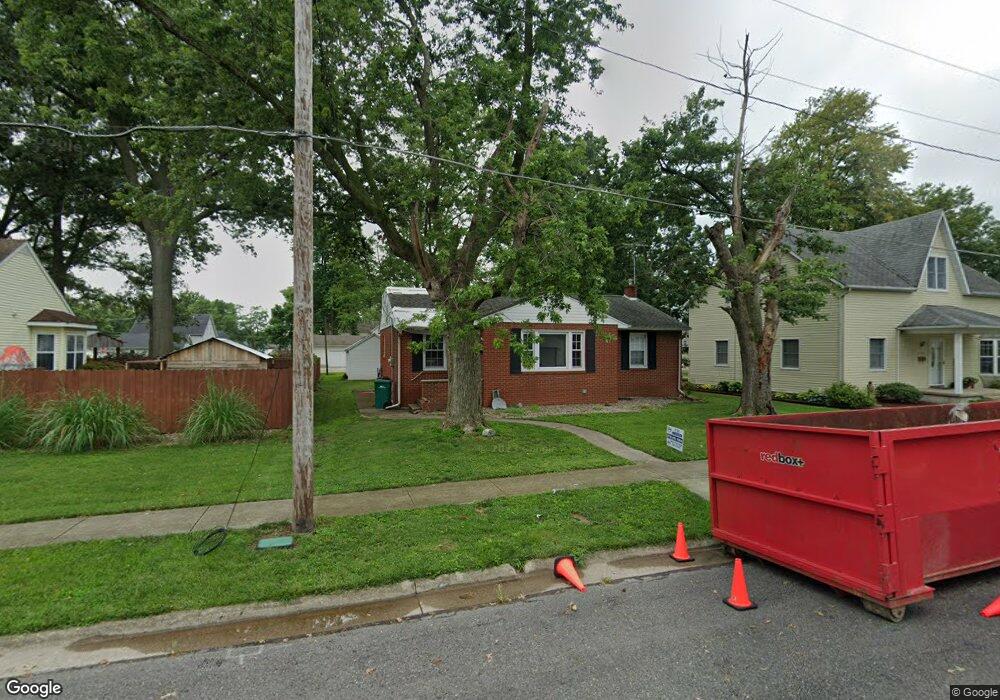
160 N 3rd St Breese, IL 62230
Estimated Value: $154,034 - $192,000
Studio
--
Bath
1,142
Sq Ft
$150/Sq Ft
Est. Value
About This Home
This home is located at 160 N 3rd St, Breese, IL 62230 and is currently estimated at $171,759, approximately $150 per square foot. 160 N 3rd St is a home located in Clinton County with nearby schools including Breese ESD #12, Beckemeyer Elementary School, and Central Community High School.
Ownership History
Date
Name
Owned For
Owner Type
Purchase Details
Closed on
May 10, 2005
Sold by
Tabble Amanda R
Bought by
Murphy Terri A
Current Estimated Value
Home Financials for this Owner
Home Financials are based on the most recent Mortgage that was taken out on this home.
Original Mortgage
$29,246
Outstanding Balance
$15,474
Interest Rate
6.07%
Mortgage Type
Stand Alone Second
Estimated Equity
$156,285
Create a Home Valuation Report for This Property
The Home Valuation Report is an in-depth analysis detailing your home's value as well as a comparison with similar homes in the area
Home Values in the Area
Average Home Value in this Area
Purchase History
| Date | Buyer | Sale Price | Title Company |
|---|---|---|---|
| Murphy Terri A | $97,000 | None Available |
Source: Public Records
Mortgage History
| Date | Status | Borrower | Loan Amount |
|---|---|---|---|
| Open | Murphy Terri A | $29,246 | |
| Open | Murphy Terri A | $93,500 |
Source: Public Records
Tax History
| Year | Tax Paid | Tax Assessment Tax Assessment Total Assessment is a certain percentage of the fair market value that is determined by local assessors to be the total taxable value of land and additions on the property. | Land | Improvement |
|---|---|---|---|---|
| 2024 | $2,718 | $45,390 | $6,840 | $38,550 |
| 2023 | $2,718 | $42,820 | $6,450 | $36,370 |
| 2022 | $2,679 | $38,920 | $5,860 | $33,060 |
| 2021 | $2,380 | $37,070 | $5,580 | $31,490 |
| 2020 | $2,322 | $35,650 | $5,370 | $30,280 |
| 2019 | $2,276 | $35,650 | $5,370 | $30,280 |
| 2018 | $2,308 | $34,392 | $5,262 | $29,130 |
| 2017 | $2,239 | $33,070 | $5,060 | $28,010 |
| 2016 | $2,217 | $33,070 | $5,060 | $28,010 |
| 2015 | $1,955 | $33,070 | $5,060 | $28,010 |
| 2013 | $1,955 | $33,760 | $5,060 | $28,700 |
Source: Public Records
Map
Nearby Homes
Your Personal Tour Guide
Ask me questions while you tour the home.