Estimated Value: $312,908 - $798,000
--
Bed
--
Bath
1,905
Sq Ft
$244/Sq Ft
Est. Value
About This Home
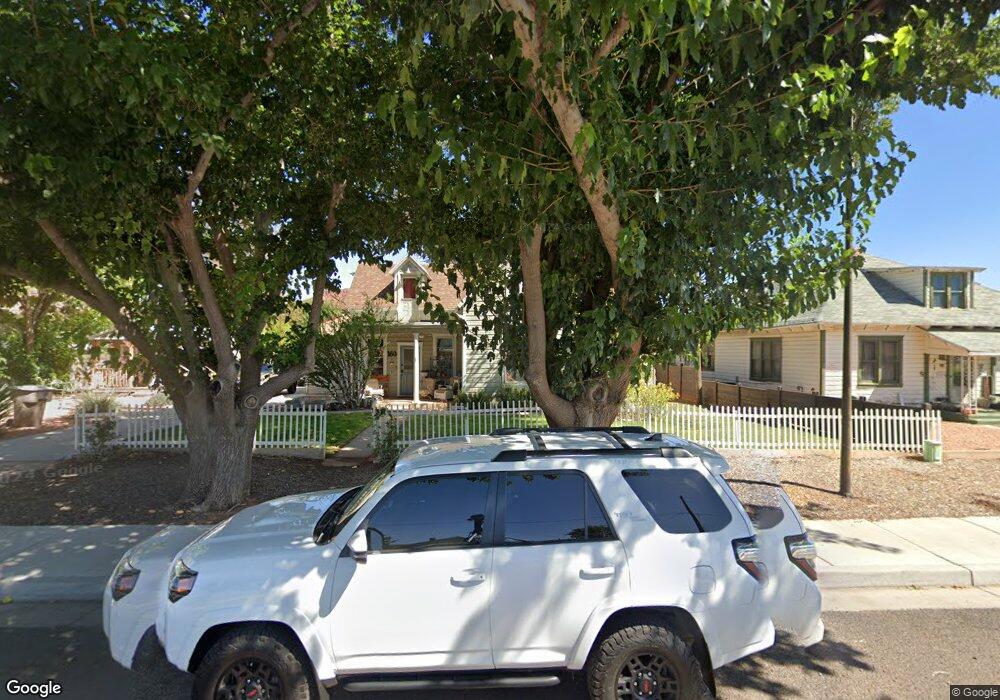
This home is located at 160 N Main St, Kanab, UT 84741 and is currently estimated at $465,727, approximately $244 per square foot. 160 N Main St is a home located in Kane County with nearby schools including Kanab Elementary School, Kanab Middle School, and Kanab High School.
Ownership History
Date
Name
Owned For
Owner Type
Purchase Details
Closed on
Nov 30, 2022
Bought by
Westmoreland Bryan Lee and Westmoreland Sharon Sue
Current Estimated Value
Purchase Details
Closed on
Mar 10, 2020
Sold by
Jeffrey Stott
Bought by
Westmoreland Bryan and Westmoreland Sharon
Purchase Details
Closed on
Sep 25, 2014
Sold by
Jessica J Jessica J and Hand Michael R
Bought by
Stott Jeffrey and Stott Mikelle
Home Financials for this Owner
Home Financials are based on the most recent Mortgage that was taken out on this home.
Original Mortgage
$150,300
Interest Rate
4.08%
Mortgage Type
Purchase Money Mortgage
Purchase Details
Closed on
Apr 13, 2009
Sold by
Mers
Bought by
Wells Fargo Financial National Bank
Home Financials for this Owner
Home Financials are based on the most recent Mortgage that was taken out on this home.
Original Mortgage
$185,415
Interest Rate
5.19%
Purchase Details
Closed on
Mar 24, 2009
Sold by
Hand Jessica J and Decker Jessica J
Bought by
Hand Jessica J and Hand Michael R
Home Financials for this Owner
Home Financials are based on the most recent Mortgage that was taken out on this home.
Original Mortgage
$185,415
Interest Rate
5.19%
Purchase Details
Closed on
Aug 19, 2008
Sold by
Decker Jessica J and Delgado-Hand Michael R
Bought by
Decker Jessica J and Hand Michael R
Home Financials for this Owner
Home Financials are based on the most recent Mortgage that was taken out on this home.
Original Mortgage
$182,675
Interest Rate
6.32%
Purchase Details
Closed on
Aug 18, 2008
Sold by
Crossroads Investments Lc
Bought by
Decker Jessica J and Delgado-Han Michael R
Home Financials for this Owner
Home Financials are based on the most recent Mortgage that was taken out on this home.
Original Mortgage
$182,675
Interest Rate
6.32%
Purchase Details
Closed on
Jul 9, 2007
Sold by
Yates Jeffry J and Clarkson Benjamin K
Bought by
Crossroads Investments Lc
Purchase Details
Closed on
Mar 30, 2007
Sold by
Reddick J Douglas and Reddick Sandra L
Bought by
Yates Jeffry J and Clarkson Benjamin K
Purchase Details
Closed on
Jan 18, 2006
Sold by
Reddick J Douglas and Reddick Sandra L
Bought by
Ramsay Grant A and Ramsay Leslie
Purchase Details
Closed on
May 23, 2005
Sold by
Reddick J Douglas and Reddick Sandra L
Bought by
Ramsay Grant A and Ramsay Leslie
Create a Home Valuation Report for This Property
The Home Valuation Report is an in-depth analysis detailing your home's value as well as a comparison with similar homes in the area
Home Values in the Area
Average Home Value in this Area
Purchase History
| Date | Buyer | Sale Price | Title Company |
|---|---|---|---|
| Westmoreland Bryan Lee | -- | -- | |
| Westmoreland Bryan | -- | -- | |
| Stott Jeffrey | -- | -- | |
| Wells Fargo Financial National Bank | -- | -- | |
| Hand Jessica J | -- | -- | |
| Decker Jessica J | -- | -- | |
| Decker Jessica J | -- | -- | |
| Crossroads Investments Lc | -- | -- | |
| Yates Jeffry J | -- | -- | |
| Ramsay Grant A | -- | -- | |
| Ramsay Grant A | -- | -- |
Source: Public Records
Mortgage History
| Date | Status | Borrower | Loan Amount |
|---|---|---|---|
| Previous Owner | Stott Jeffrey | $150,300 | |
| Previous Owner | Hand Jessica J | $185,415 | |
| Previous Owner | Decker Jessica J | $182,675 |
Source: Public Records
Tax History Compared to Growth
Tax History
| Year | Tax Paid | Tax Assessment Tax Assessment Total Assessment is a certain percentage of the fair market value that is determined by local assessors to be the total taxable value of land and additions on the property. | Land | Improvement |
|---|---|---|---|---|
| 2025 | $1,763 | $187,148 | $62,202 | $124,946 |
| 2024 | $1,763 | $204,902 | $51,854 | $153,048 |
| 2023 | $1,583 | $188,519 | $49,384 | $139,135 |
| 2022 | $1,395 | $164,474 | $37,988 | $126,486 |
| 2021 | $1,263 | $223,481 | $53,130 | $170,351 |
| 2020 | $1,193 | $204,957 | $48,300 | $156,657 |
| 2019 | $1,250 | $209,186 | $46,860 | $162,326 |
| 2018 | $1,214 | $201,376 | $39,050 | $162,326 |
| 2017 | $1,159 | $183,599 | $35,500 | $148,099 |
| 2016 | $1,028 | $158,126 | $35,500 | $122,626 |
| 2015 | $763 | $136,065 | $35,500 | $100,565 |
| 2014 | $763 | $116,719 | $37,908 | $78,811 |
| 2013 | -- | $64,195 | $0 | $0 |
Source: Public Records
Map
Nearby Homes