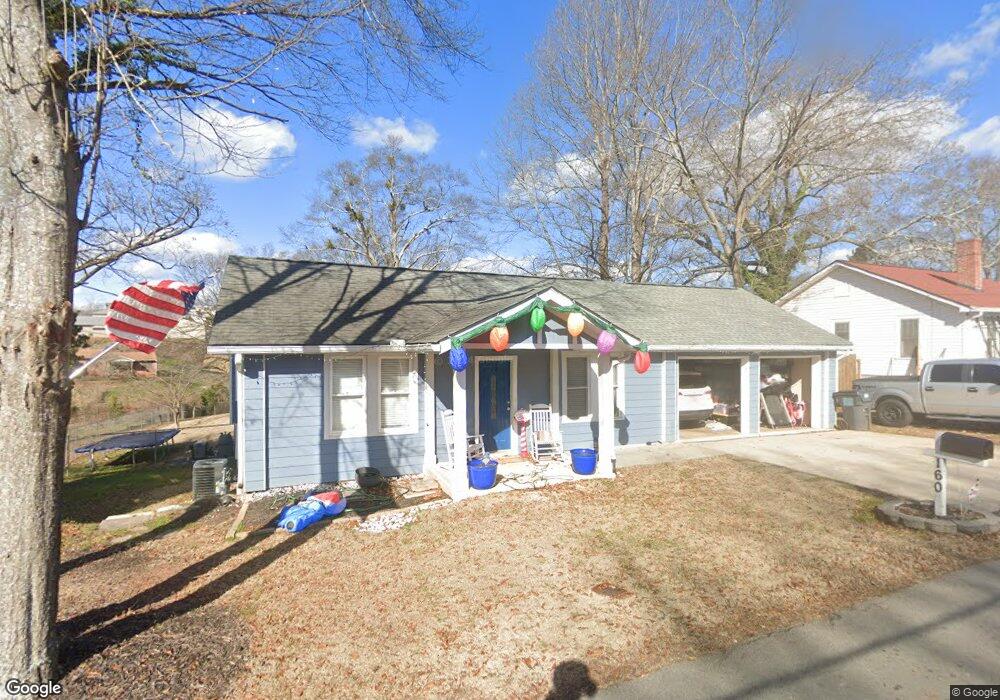
160 New St Buford, GA 30518
Estimated Value: $328,000 - $380,000
3
Beds
2
Baths
1,400
Sq Ft
$256/Sq Ft
Est. Value
About This Home
This home is located at 160 New St, Buford, GA 30518 and is currently estimated at $358,429, approximately $256 per square foot. 160 New St is a home located in Gwinnett County with nearby schools including Buford Elementary School, Buford Senior Academy, and Buford Academy.
Ownership History
Date
Name
Owned For
Owner Type
Purchase Details
Closed on
Aug 16, 2016
Sold by
Mchan Neil T and Mchan Samantha L
Bought by
Gall Gregory T and Gall Robin L
Current Estimated Value
Home Financials for this Owner
Home Financials are based on the most recent Mortgage that was taken out on this home.
Original Mortgage
$213,750
Outstanding Balance
$169,453
Interest Rate
3.45%
Estimated Equity
$188,976
Purchase Details
Closed on
Mar 25, 2008
Sold by
Mchan Neil T
Bought by
Mchan Neil T and Mchan Samantha L
Home Financials for this Owner
Home Financials are based on the most recent Mortgage that was taken out on this home.
Original Mortgage
$145,601
Interest Rate
5.84%
Purchase Details
Closed on
Mar 16, 2007
Sold by
Cook William R and Cook Carol D
Bought by
Mchan Neil T and Tucker Bonnie
Home Financials for this Owner
Home Financials are based on the most recent Mortgage that was taken out on this home.
Original Mortgage
$130,935
Interest Rate
6.22%
Create a Home Valuation Report for This Property
The Home Valuation Report is an in-depth analysis detailing your home's value as well as a comparison with similar homes in the area
Home Values in the Area
Average Home Value in this Area
Purchase History
| Date | Buyer | Sale Price | Title Company |
|---|---|---|---|
| Gall Gregory T | $225,000 | -- | |
| Mchan Neil T | -- | -- | |
| Mchan Neil T | $133,000 | -- |
Source: Public Records
Mortgage History
| Date | Status | Borrower | Loan Amount |
|---|---|---|---|
| Open | Gall Gregory T | $213,750 | |
| Previous Owner | Mchan Neil T | $145,601 | |
| Previous Owner | Mchan Neil T | $130,935 |
Source: Public Records
Tax History Compared to Growth
Tax History
| Year | Tax Paid | Tax Assessment Tax Assessment Total Assessment is a certain percentage of the fair market value that is determined by local assessors to be the total taxable value of land and additions on the property. | Land | Improvement |
|---|---|---|---|---|
| 2025 | $369 | $96,000 | $33,600 | $62,400 |
| 2024 | $369 | $111,240 | $33,600 | $77,640 |
| 2023 | $369 | $79,320 | $26,000 | $53,320 |
| 2022 | $369 | $79,320 | $26,000 | $53,320 |
| 2021 | $369 | $47,800 | $16,800 | $31,000 |
| 2020 | $369 | $47,800 | $16,800 | $31,000 |
| 2019 | $333 | $47,800 | $16,800 | $31,000 |
| 2018 | $333 | $49,680 | $8,800 | $40,880 |
| 2016 | $455 | $35,480 | $5,600 | $29,880 |
| 2015 | $471 | $35,480 | $5,600 | $29,880 |
| 2014 | -- | $33,240 | $5,600 | $27,640 |
Source: Public Records
Map
Nearby Homes