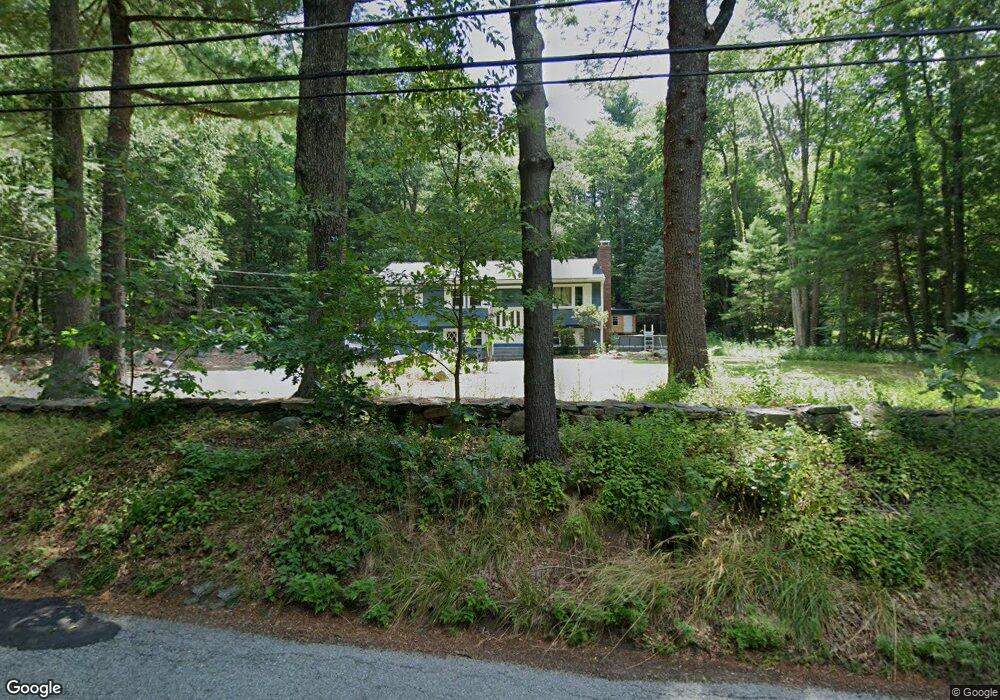
160 Olive St Ashland, MA 01721
Estimated Value: $610,000 - $635,613
3
Beds
2
Baths
1,500
Sq Ft
$415/Sq Ft
Est. Value
About This Home
This home is located at 160 Olive St, Ashland, MA 01721 and is currently estimated at $623,153, approximately $415 per square foot. 160 Olive St is a home located in Middlesex County with nearby schools including William Pittaway Elementary School, David Mindess Elementary School, and Henry E. Warren Elementary School.
Ownership History
Date
Name
Owned For
Owner Type
Purchase Details
Closed on
Feb 15, 2007
Sold by
Field James M
Bought by
Ackley David T and Phillips Elizabeth F
Current Estimated Value
Home Financials for this Owner
Home Financials are based on the most recent Mortgage that was taken out on this home.
Original Mortgage
$282,000
Interest Rate
6.24%
Mortgage Type
Purchase Money Mortgage
Purchase Details
Closed on
Dec 10, 2004
Sold by
Neenan Jennifer K and Neenan Michael A
Bought by
Field James M
Home Financials for this Owner
Home Financials are based on the most recent Mortgage that was taken out on this home.
Original Mortgage
$280,000
Interest Rate
5.63%
Mortgage Type
Purchase Money Mortgage
Purchase Details
Closed on
Sep 10, 1998
Sold by
Schouler Fred A and Schouler Phyllis J
Bought by
Neenan Michael and Lawton Jennifer K
Home Financials for this Owner
Home Financials are based on the most recent Mortgage that was taken out on this home.
Original Mortgage
$171,000
Interest Rate
6.92%
Mortgage Type
Purchase Money Mortgage
Create a Home Valuation Report for This Property
The Home Valuation Report is an in-depth analysis detailing your home's value as well as a comparison with similar homes in the area
Home Values in the Area
Average Home Value in this Area
Purchase History
| Date | Buyer | Sale Price | Title Company |
|---|---|---|---|
| Ackley David T | $352,500 | -- | |
| Field James M | $370,000 | -- | |
| Neenan Michael | $180,000 | -- |
Source: Public Records
Mortgage History
| Date | Status | Borrower | Loan Amount |
|---|---|---|---|
| Open | Neenan Michael | $270,575 | |
| Closed | Ackley David T | $282,000 | |
| Previous Owner | Field James M | $280,000 | |
| Previous Owner | Neenan Michael | $171,000 | |
| Previous Owner | Neenan Michael | $24,000 |
Source: Public Records
Tax History
| Year | Tax Paid | Tax Assessment Tax Assessment Total Assessment is a certain percentage of the fair market value that is determined by local assessors to be the total taxable value of land and additions on the property. | Land | Improvement |
|---|---|---|---|---|
| 2025 | $7,095 | $555,600 | $261,700 | $293,900 |
| 2024 | $7,019 | $530,100 | $261,700 | $268,400 |
| 2023 | $6,443 | $467,900 | $249,400 | $218,500 |
| 2022 | $6,528 | $411,100 | $226,400 | $184,700 |
| 2021 | $21,152 | $379,800 | $226,400 | $153,400 |
| 2020 | $14,950 | $361,900 | $226,400 | $135,500 |
| 2019 | $5,718 | $351,200 | $226,400 | $124,800 |
| 2018 | $13,058 | $339,500 | $223,800 | $115,700 |
| 2017 | $5,511 | $330,000 | $223,800 | $106,200 |
| 2016 | $5,314 | $312,600 | $219,000 | $93,600 |
| 2015 | $5,097 | $294,600 | $205,800 | $88,800 |
| 2014 | $4,840 | $278,300 | $192,000 | $86,300 |
Source: Public Records
Map
Nearby Homes
- 15 Haven Way
- 9 Olive St
- 19 Crispwater Way Unit 178
- 11 N Mill St
- 20 Braeburn Ln
- 22 Wilbur Dr
- 2 Braeburn Ln
- 0 Cross St
- 37 Garett Way Unit 37
- 33 Garett Way Unit 33
- 54 Garett Way Unit 54
- 257-259 Main St
- 0 Ballard Highland Marietta Unit 73391306
- 203 Pleasant St
- 6 Waterville Ln Unit 6
- 147 N Mill St
- 96 Pleasant St Unit 96
- 14 Waterville Ln Unit 14
- 1 Westfield Rd
- 30 Waterville Ln Unit 30
- 164 Olive St
- 157 Olive St
- 156 Olive St
- 161 Olive St
- 151 Olive St
- 168 Olive St
- 8 Lafollette Rd
- 177 Olive St
- 10 Lafollette Rd Unit 1
- 10 Lafollette Rd
- 180 Olive St
- 142 Olive St
- 2 Lafollette Rd
- 12 Lafollette Rd
- 1 Lafollette Rd
- 183 Olive St
- 7 Lafollette Rd
- 28 Lafollette Rd
- 3 Lafollette Rd
- 9 Lafollette Rd
Your Personal Tour Guide
Ask me questions while you tour the home.