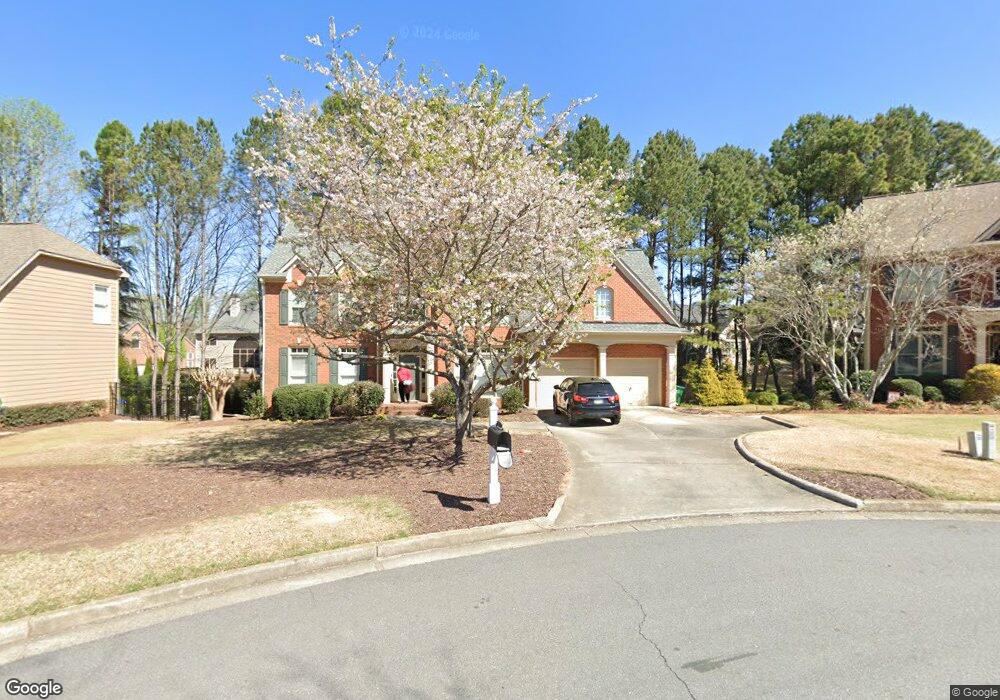
160 Overhill Point Unit V1B Alpharetta, GA 30005
Seven Oaks NeighborhoodEstimated Value: $769,000 - $909,000
4
Beds
4
Baths
2,807
Sq Ft
$292/Sq Ft
Est. Value
About This Home
This home is located at 160 Overhill Point Unit V1B, Alpharetta, GA 30005 and is currently estimated at $820,878, approximately $292 per square foot. 160 Overhill Point Unit V1B is a home located in Fulton County with nearby schools including Taylor Road Middle School, Chattahoochee High School, and Valor Christian Academy.
Ownership History
Date
Name
Owned For
Owner Type
Purchase Details
Closed on
Nov 20, 2020
Sold by
Scaggs James M
Bought by
Scaggs James Michael and Scaggs Family Living Trust
Current Estimated Value
Purchase Details
Closed on
Mar 3, 1999
Sold by
Contrael Barry R and Contrael Janell M
Bought by
Scaggs James M
Home Financials for this Owner
Home Financials are based on the most recent Mortgage that was taken out on this home.
Original Mortgage
$252,600
Interest Rate
6.73%
Mortgage Type
New Conventional
Purchase Details
Closed on
Mar 13, 1998
Sold by
John Wieland Homes Inc
Bought by
Contreal Barry R and Contreal Janell M
Home Financials for this Owner
Home Financials are based on the most recent Mortgage that was taken out on this home.
Original Mortgage
$202,850
Interest Rate
7.14%
Mortgage Type
New Conventional
Create a Home Valuation Report for This Property
The Home Valuation Report is an in-depth analysis detailing your home's value as well as a comparison with similar homes in the area
Home Values in the Area
Average Home Value in this Area
Purchase History
| Date | Buyer | Sale Price | Title Company |
|---|---|---|---|
| Scaggs James Michael | -- | -- | |
| Scaggs James M | $265,900 | -- | |
| Contreal Barry R | $253,700 | -- |
Source: Public Records
Mortgage History
| Date | Status | Borrower | Loan Amount |
|---|---|---|---|
| Previous Owner | Scaggs James M | $252,600 | |
| Previous Owner | Contreal Barry R | $202,850 |
Source: Public Records
Tax History Compared to Growth
Tax History
| Year | Tax Paid | Tax Assessment Tax Assessment Total Assessment is a certain percentage of the fair market value that is determined by local assessors to be the total taxable value of land and additions on the property. | Land | Improvement |
|---|---|---|---|---|
| 2025 | $5,043 | $269,560 | $83,920 | $185,640 |
| 2023 | $8,011 | $283,800 | $76,520 | $207,280 |
| 2022 | $4,829 | $221,000 | $58,000 | $163,000 |
| 2021 | $4,768 | $165,520 | $42,640 | $122,880 |
| 2020 | $4,632 | $163,200 | $37,360 | $125,840 |
| 2019 | $548 | $160,320 | $36,720 | $123,600 |
| 2018 | $4,657 | $156,560 | $35,840 | $120,720 |
| 2017 | $4,689 | $150,200 | $34,440 | $115,760 |
| 2016 | $4,622 | $150,200 | $34,440 | $115,760 |
| 2015 | $4,793 | $154,640 | $34,440 | $120,200 |
| 2014 | $4,648 | $144,840 | $32,240 | $112,600 |
Source: Public Records
Map
Nearby Homes
- 110 W Meadows Ct
- 5785 Oxborough Way Unit 1
- 5575 Ashwind Trace
- 11420 Crossington Rd
- 11615 Windbrooke Way
- 12205 Stevens Creek Dr
- 585 Meadows Creek Dr
- 230 Sessingham Ln
- 11835 Leeward Walk Cir
- 5455 Woodrun Ln
- 5610 N Hillbrooke Trace
- 7335 Lytham Trace
- 11915 Carriage Park Ln
- 5650 Preserve Cir
- 775 Ellsborough Ct
- 205 Ashebourne Trail
- 150 Overhill Point
- 161 Overhill Point
- 5745 Seven Oaks Pkwy Unit 7
- 5735 Seven Oaks Pkwy Unit 4A
- 5755 Seven Oaks Pkwy Unit 7
- 140 Overhill Point
- 131 Overhill Point
- 121 Overhill Point
- 590 Williston Way Unit 3A
- 141 Overhill Point Unit VIB
- 580 Williston Way
- 5765 Seven Oaks Pkwy
- 5725 Seven Oaks Pkwy
- 130 Overhill Point Unit 4B
- 111 Overhill Point
- 5710 Seven Oaks Pkwy
- 570 Williston Way Unit 3A
- 5775 Seven Oaks Pkwy Unit 7
- 5720 Seven Oaks Pkwy
- 5700 Seven Oaks Pkwy Unit 4A