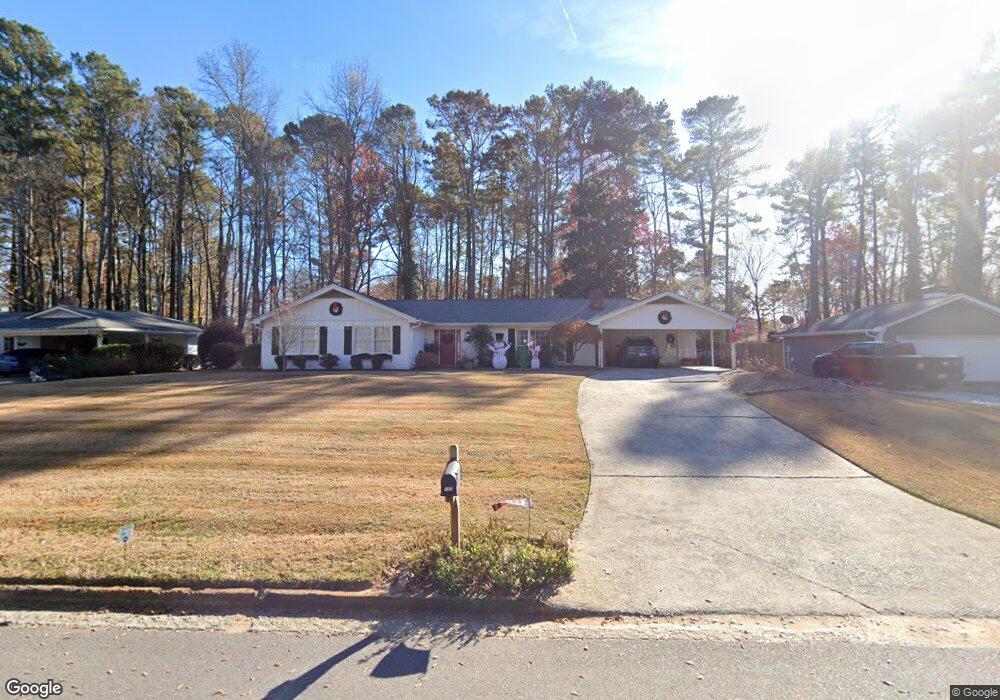
160 Pebble Trail Unit 1 Alpharetta, GA 30009
Estimated Value: $990,608 - $1,100,000
4
Beds
2
Baths
1,976
Sq Ft
$532/Sq Ft
Est. Value
About This Home
This home is located at 160 Pebble Trail Unit 1, Alpharetta, GA 30009 and is currently estimated at $1,051,152, approximately $531 per square foot. 160 Pebble Trail Unit 1 is a home located in Fulton County with nearby schools including Alpharetta Elementary School, Hopewell Middle School, and Cambridge High School.
Ownership History
Date
Name
Owned For
Owner Type
Purchase Details
Closed on
Jun 17, 2025
Sold by
Supernova Properties Llc
Bought by
Aliassa Behzad and Fallah Jinoos Farhang
Current Estimated Value
Home Financials for this Owner
Home Financials are based on the most recent Mortgage that was taken out on this home.
Original Mortgage
$787,500
Outstanding Balance
$785,498
Interest Rate
6.86%
Mortgage Type
New Conventional
Estimated Equity
$265,654
Purchase Details
Closed on
May 30, 2025
Sold by
Aliassa Behzad
Bought by
Supernova Properties Llc
Home Financials for this Owner
Home Financials are based on the most recent Mortgage that was taken out on this home.
Original Mortgage
$787,500
Outstanding Balance
$785,498
Interest Rate
6.86%
Mortgage Type
New Conventional
Estimated Equity
$265,654
Purchase Details
Closed on
Apr 15, 2016
Sold by
Knox Richard
Bought by
160 Pebble Llc
Purchase Details
Closed on
Oct 21, 2013
Sold by
Norvell Bruce W
Bought by
Dodson Stephen W and Dodson Katherine H
Home Financials for this Owner
Home Financials are based on the most recent Mortgage that was taken out on this home.
Original Mortgage
$205,200
Interest Rate
4.52%
Mortgage Type
New Conventional
Purchase Details
Closed on
Jun 30, 2010
Sold by
Wynne Carolyn A
Bought by
Norvell Bruce W and Norvell Kay M
Home Financials for this Owner
Home Financials are based on the most recent Mortgage that was taken out on this home.
Original Mortgage
$132,640
Interest Rate
4.79%
Mortgage Type
New Conventional
Purchase Details
Closed on
Dec 15, 1999
Sold by
Wynne Jack D
Bought by
Wynne Carolyn A
Purchase Details
Closed on
Dec 7, 1999
Sold by
Wynne Jack D
Bought by
Wynne Carolyn A
Create a Home Valuation Report for This Property
The Home Valuation Report is an in-depth analysis detailing your home's value as well as a comparison with similar homes in the area
Home Values in the Area
Average Home Value in this Area
Purchase History
| Date | Buyer | Sale Price | Title Company |
|---|---|---|---|
| Aliassa Behzad | -- | -- | |
| Supernova Properties Llc | -- | -- | |
| Aliassa Behzad | $1,055,000 | -- | |
| 590 Holdings Llc | $1,005,000 | -- | |
| 160 Pebble Llc | -- | -- | |
| Knox Richard | $337,000 | -- | |
| Dodson Stephen W | $228,000 | -- | |
| Norvell Bruce W | $165,800 | -- | |
| Wynne Carolyn A | -- | -- | |
| Wynne Carolyn A | -- | -- | |
| Wynne Carolyn A | -- | -- | |
| Wynne Carolyn A | -- | -- |
Source: Public Records
Mortgage History
| Date | Status | Borrower | Loan Amount |
|---|---|---|---|
| Open | Aliassa Behzad | $787,500 | |
| Previous Owner | Dodson Stephen W | $205,200 | |
| Previous Owner | Norvell Bruce W | $132,640 |
Source: Public Records
Tax History Compared to Growth
Tax History
| Year | Tax Paid | Tax Assessment Tax Assessment Total Assessment is a certain percentage of the fair market value that is determined by local assessors to be the total taxable value of land and additions on the property. | Land | Improvement |
|---|---|---|---|---|
| 2025 | $1,239 | $303,560 | $97,920 | $205,640 |
| 2023 | $5,798 | $205,400 | $60,800 | $144,600 |
| 2022 | $4,460 | $169,520 | $38,440 | $131,080 |
| 2021 | $4,119 | $125,280 | $32,800 | $92,480 |
| 2020 | $3,939 | $117,440 | $38,480 | $78,960 |
| 2019 | $676 | $117,520 | $22,680 | $94,840 |
| 2018 | $3,238 | $114,720 | $22,120 | $92,600 |
| 2017 | $2,410 | $82,600 | $25,880 | $56,720 |
| 2016 | $2,411 | $82,600 | $25,880 | $56,720 |
| 2015 | $2,895 | $82,600 | $25,880 | $56,720 |
| 2014 | $1,663 | $54,240 | $17,000 | $37,240 |
Source: Public Records
Map
Nearby Homes
- 195 Shady Grove Ln
- 150 Shady Grove Ln
- 193 Jere Dr
- 2130 Canton View
- 284 Hook St
- 320 Shady Grove Ln
- 295 Pebble Trail
- 265 Mayfield Rd
- 322 Pebble Trail
- 250 Mayfield Rd
- 260 Mayfield Rd
- 141 North Trace
- 264 N Main St
- 254 N Main St
- 215 Mayfield Cir
- 3010 Westside Ct Unit 1
- 205 Mayfield Cir
- 2433 Santa Rosa St
- 192 Upshaw Dr
- 160 Pebble Trail
- 170 Pebble Trail
- 150 Pebble Trail Unit 15
- 150 Pebble Trail
- 180 Pebble Trail
- 140 Pebble Trail
- 165 Shady Grove Ln
- 175 Shady Grove Ln
- 155 Shady Grove Ln
- 165 Pebble Trail Unit 14
- 165 Pebble Trail
- 175 Pebble Trail
- 155 Pebble Trail
- 185 Shady Grove Ln
- 145 Shady Grove Ln
- 190 Pebble Trail
- 130 Pebble Trail
- 185 Pebble Trail
- 145 Pebble Trail
- 135 Shady Grove Ln