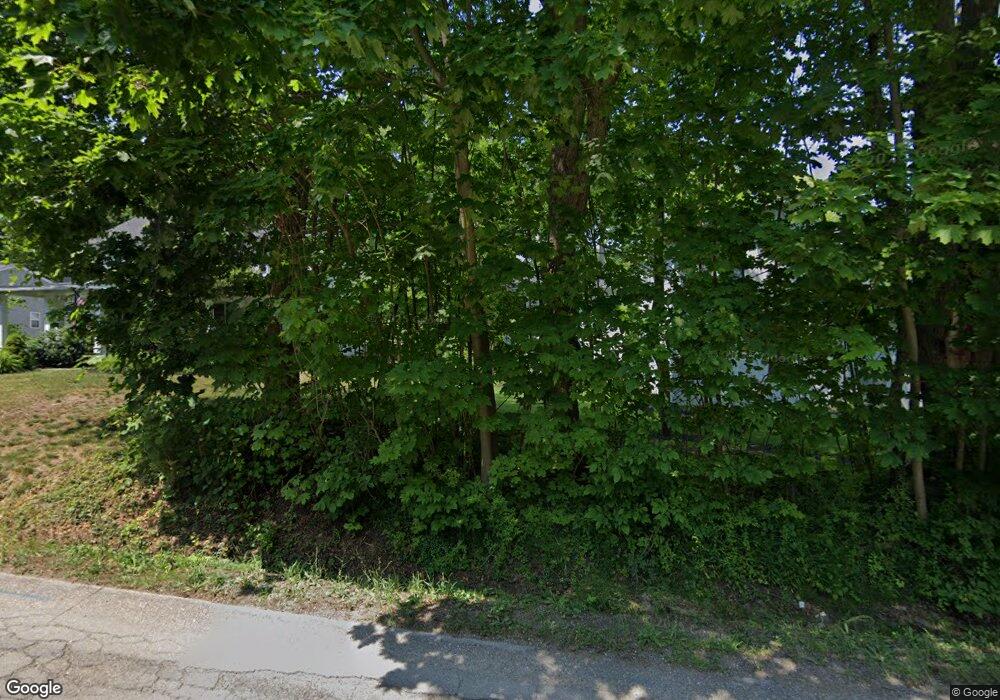
160 S Maple St Saugatuck, MI 49453
Estimated Value: $580,000 - $782,000
2
Beds
2
Baths
924
Sq Ft
$770/Sq Ft
Est. Value
About This Home
This home is located at 160 S Maple St, Saugatuck, MI 49453 and is currently estimated at $711,116, approximately $769 per square foot. 160 S Maple St is a home located in Allegan County with nearby schools including Douglas Elementary School, Saugatuck Middle School, and Saugatuck High School.
Ownership History
Date
Name
Owned For
Owner Type
Purchase Details
Closed on
Sep 19, 2011
Sold by
Whitmyer James and Valenti Matteo
Bought by
Valenti Matteo and Whitmyer James H
Current Estimated Value
Purchase Details
Closed on
Apr 28, 2006
Sold by
Henke Bruce W and Henke Donna K
Bought by
Whitmyer James and Valenti Matteo
Home Financials for this Owner
Home Financials are based on the most recent Mortgage that was taken out on this home.
Original Mortgage
$146,000
Outstanding Balance
$84,509
Interest Rate
6.39%
Mortgage Type
Fannie Mae Freddie Mac
Estimated Equity
$626,607
Purchase Details
Closed on
Mar 9, 2001
Sold by
Scott Julie L
Bought by
Henke Bruce W and Henke Donna K
Purchase Details
Closed on
Dec 12, 1997
Sold by
Priestap David
Bought by
Scott Julie L
Create a Home Valuation Report for This Property
The Home Valuation Report is an in-depth analysis detailing your home's value as well as a comparison with similar homes in the area
Home Values in the Area
Average Home Value in this Area
Purchase History
| Date | Buyer | Sale Price | Title Company |
|---|---|---|---|
| Valenti Matteo | -- | None Available | |
| Whitmyer James | -- | None Available | |
| Henke Bruce W | -- | -- | |
| Scott Julie L | $110,000 | -- |
Source: Public Records
Mortgage History
| Date | Status | Borrower | Loan Amount |
|---|---|---|---|
| Open | Whitmyer James | $146,000 |
Source: Public Records
Tax History
| Year | Tax Paid | Tax Assessment Tax Assessment Total Assessment is a certain percentage of the fair market value that is determined by local assessors to be the total taxable value of land and additions on the property. | Land | Improvement |
|---|---|---|---|---|
| 2025 | $7,313 | $360,600 | $155,700 | $204,900 |
| 2024 | -- | $308,100 | $133,900 | $174,200 |
| 2023 | -- | $228,100 | $94,000 | $134,100 |
| 2022 | $0 | $176,100 | $57,800 | $118,300 |
| 2020 | $6,174 | $155,700 | $52,500 | $103,200 |
| 2019 | $0 | $128,200 | $50,400 | $77,800 |
| 2018 | $0 | $107,900 | $45,400 | $62,500 |
| 2017 | $0 | $118,300 | $57,600 | $60,700 |
| 2016 | $0 | $121,500 | $57,600 | $63,900 |
| 2015 | -- | $121,500 | $57,600 | $63,900 |
| 2014 | -- | $109,700 | $57,600 | $52,100 |
| 2013 | -- | $96,000 | $57,600 | $38,400 |
Source: Public Records
Map
Nearby Homes
- Lot 2 Blue Star Hwy
- 445 S Maple St
- 1020 Allegan St
- 790 Lake St
- 510 S Maple St
- 64 Griffith St Unit 17
- 0 Washington St Unit Parcel 1.1 25037018
- 60 Swing Bridge Ln
- 3341 Gaslight Ln
- 3351 Gaslight Ln
- 11 E Chestnut St Unit 1
- 6440 Gaslight Ln
- VL Park St
- N of 3365 Clearview Ln
- 251 North St
- 160 Keewatin Way Unit D/9
- Lot Jack Wilson Rd
- 6593 134th Ave
- 150 W Center St Unit G
- 293 Sugar Hill Ct Unit 2
- 186 S Maple St
- 198 S Maple St
- 1001 Allegan St
- 210 S Maple St
- 6594 Old Allegan Rd
- 6594 Allegan St
- 191 S Maple St
- 1010 Allegan St
- 207 S Maple St
- 963 Allegan St
- 6597 Old Allegan Rd
- 1024 Allegan St
- 1018 Allegan St
- 986 Allegan St
- 905 Allegan St
- 940 Pleasant St
- 133 Taylor St
- 974 Allegan St
- 1034 State St
- 904 Allegan St