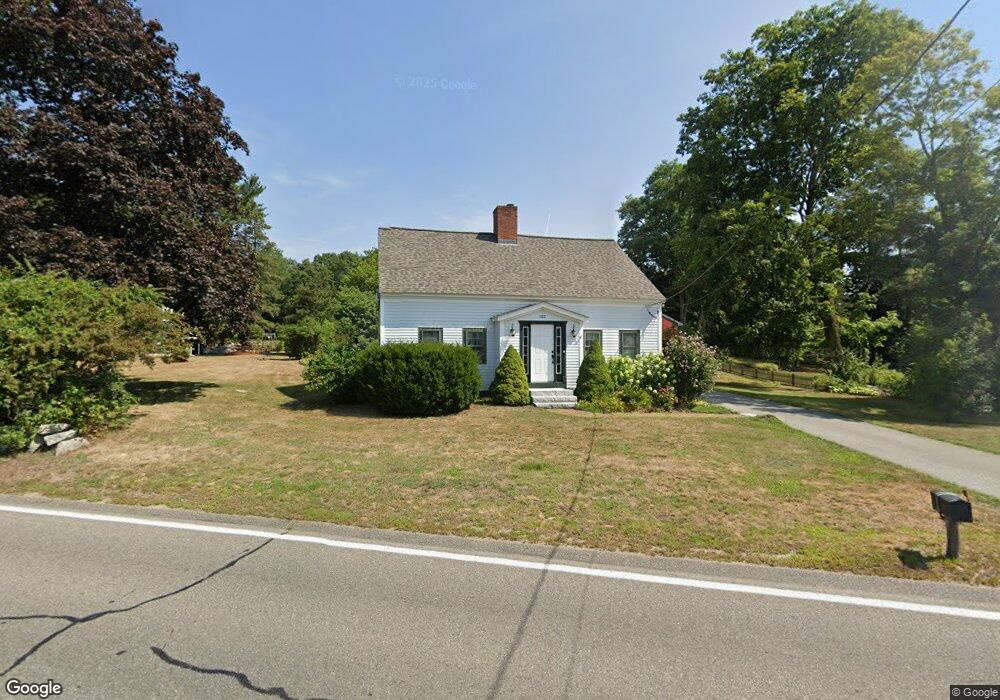
160 Salem St Wilmington, MA 01887
Estimated Value: $766,000 - $897,000
3
Beds
2
Baths
1,997
Sq Ft
$422/Sq Ft
Est. Value
About This Home
This home is located at 160 Salem St, Wilmington, MA 01887 and is currently estimated at $842,923, approximately $422 per square foot. 160 Salem St is a home located in Middlesex County with nearby schools including Wilmington Middle School, Wilmington High School, and Abundant Life Christian School and Childcare.
Ownership History
Date
Name
Owned For
Owner Type
Purchase Details
Closed on
Aug 30, 2019
Sold by
Johnson Nancy L
Bought by
160 Salem Street Rt 2019 and Johnson
Current Estimated Value
Purchase Details
Closed on
Sep 29, 1993
Sold by
Sultz Marne B and Goodrich Peter
Bought by
Chase Timothy J and Bierstedt Rebecca
Purchase Details
Closed on
Dec 15, 1989
Sold by
Corum James
Bought by
Sutz Marne
Create a Home Valuation Report for This Property
The Home Valuation Report is an in-depth analysis detailing your home's value as well as a comparison with similar homes in the area
Home Values in the Area
Average Home Value in this Area
Purchase History
| Date | Buyer | Sale Price | Title Company |
|---|---|---|---|
| 160 Salem Street Rt 2019 | -- | -- | |
| Chase Timothy J | $175,000 | -- | |
| Sutz Marne | $179,900 | -- |
Source: Public Records
Mortgage History
| Date | Status | Borrower | Loan Amount |
|---|---|---|---|
| Previous Owner | Sutz Marne | $300,000 | |
| Previous Owner | Sutz Marne | $127,462 |
Source: Public Records
Tax History Compared to Growth
Tax History
| Year | Tax Paid | Tax Assessment Tax Assessment Total Assessment is a certain percentage of the fair market value that is determined by local assessors to be the total taxable value of land and additions on the property. | Land | Improvement |
|---|---|---|---|---|
| 2025 | $8,113 | $708,600 | $294,700 | $413,900 |
| 2024 | $7,799 | $682,300 | $294,700 | $387,600 |
| 2023 | $7,466 | $625,300 | $267,900 | $357,400 |
| 2022 | $7,460 | $572,500 | $223,300 | $349,200 |
| 2021 | $7,157 | $517,100 | $202,900 | $314,200 |
| 2020 | $7,116 | $524,000 | $202,900 | $321,100 |
| 2019 | $6,882 | $500,500 | $193,200 | $307,300 |
| 2018 | $6,634 | $460,400 | $183,900 | $276,500 |
| 2017 | $6,065 | $419,700 | $183,900 | $235,800 |
| 2016 | $5,875 | $401,600 | $175,100 | $226,500 |
| 2015 | $5,639 | $392,400 | $175,100 | $217,300 |
| 2014 | $5,151 | $361,700 | $166,600 | $195,100 |
Source: Public Records
Map
Nearby Homes