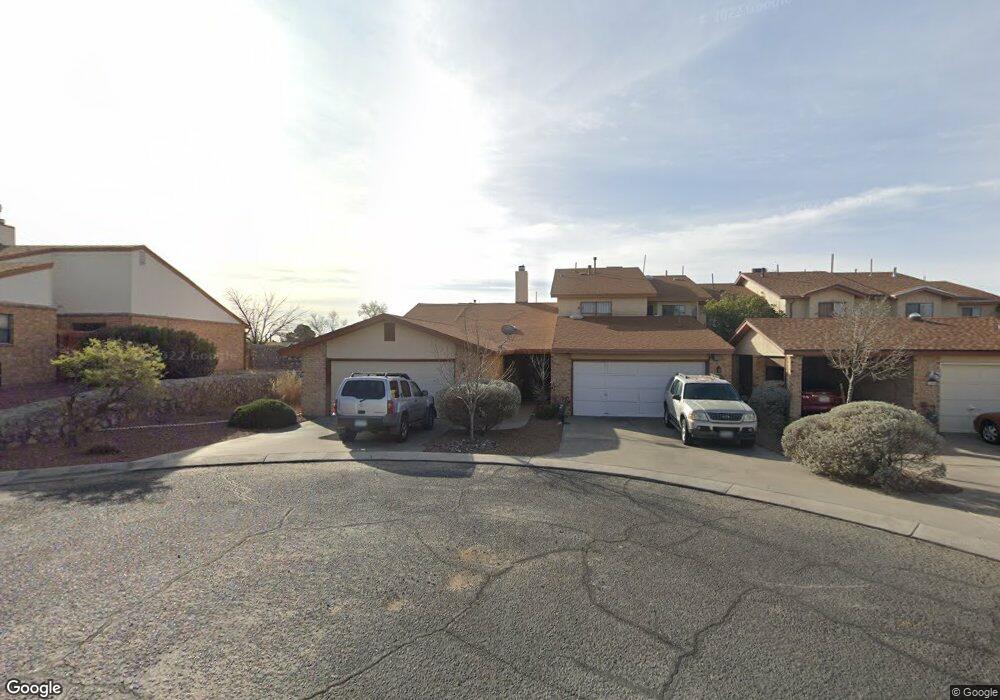
160 Silver Shadow Dr Unit C El Paso, TX 79912
Remcon NeighborhoodEstimated Value: $232,029 - $277,000
Studio
2
Baths
2,257
Sq Ft
$113/Sq Ft
Est. Value
About This Home
This home is located at 160 Silver Shadow Dr Unit C, El Paso, TX 79912 and is currently estimated at $254,757, approximately $112 per square foot. 160 Silver Shadow Dr Unit C is a home located in El Paso County with nearby schools including Putnam Elementary School, Coronado High School, and Howard Burnham Elementary School.
Ownership History
Date
Name
Owned For
Owner Type
Purchase Details
Closed on
Mar 2, 2026
Sold by
Carmona Martha
Bought by
Carmona Martha and Carmona Laura Esperanza
Current Estimated Value
Purchase Details
Closed on
Sep 23, 2023
Sold by
Carmona Nieto Martha
Bought by
Carmona Martha S
Purchase Details
Closed on
Jan 15, 2020
Sold by
Carmona Martha S
Bought by
Carmona Martha S and Nieto Martha Carmona
Purchase Details
Closed on
Feb 22, 2012
Sold by
Silver Shadow Llc
Bought by
Beard Walker Rankin and Beard Stephanie Onick
Home Financials for this Owner
Home Financials are based on the most recent Mortgage that was taken out on this home.
Original Mortgage
$85,000
Interest Rate
3.91%
Mortgage Type
New Conventional
Purchase Details
Closed on
Feb 1, 2010
Sold by
Snare Raymond Jordan and Snare Marcia
Bought by
Carmona Martha S
Purchase Details
Closed on
Jul 21, 2009
Sold by
Snare Raymond Jordan
Bought by
Snare Raymond Jordan
Create a Home Valuation Report for This Property
The Home Valuation Report is an in-depth analysis detailing your home's value as well as a comparison with similar homes in the area
Home Values in the Area
Average Home Value in this Area
Purchase History
| Date | Buyer | Sale Price | Title Company |
|---|---|---|---|
| Carmona Martha | -- | None Listed On Document | |
| Carmona Martha S | -- | None Listed On Document | |
| Carmona Martha S | -- | None Available | |
| Beard Walker Rankin | -- | None Available | |
| Carmona Martha S | -- | None Available | |
| Snare Raymond Jordan | -- | None Available |
Source: Public Records
Mortgage History
| Date | Status | Borrower | Loan Amount |
|---|---|---|---|
| Previous Owner | Beard Walker Rankin | $85,000 |
Source: Public Records
Tax History
| Year | Tax Paid | Tax Assessment Tax Assessment Total Assessment is a certain percentage of the fair market value that is determined by local assessors to be the total taxable value of land and additions on the property. | Land | Improvement |
|---|---|---|---|---|
| 2025 | $1,842 | $168,539 | -- | -- |
| 2024 | $1,842 | $153,217 | -- | -- |
| 2023 | $1,754 | $139,288 | $0 | $0 |
| 2022 | $3,748 | $126,625 | $21,261 | $105,364 |
| 2021 | $3,856 | $123,489 | $21,261 | $102,228 |
| 2020 | $3,552 | $115,571 | $10,320 | $105,251 |
| 2018 | $3,421 | $115,571 | $10,320 | $105,251 |
| 2017 | $2,974 | $105,573 | $10,320 | $95,253 |
| 2016 | $2,974 | $105,573 | $10,320 | $95,253 |
| 2015 | $2,209 | $105,573 | $10,320 | $95,253 |
| 2014 | $2,209 | $105,573 | $10,320 | $95,253 |
Source: Public Records
Map
Nearby Homes
- 160 Silver Shadow Dr Unit A
- 150 Silver Shadow Dr Unit D
- 201 Desert Pass St Unit 9
- 201 Desert Pass St Unit 1
- 201 Desert Pass St Unit 5
- 229 Montego Bay Dr Unit 2
- 211 Montego Bay Dr
- 301 Resler Ridge Dr
- PN319033 Tbd Western Skies
- 226 Paso Noble Dr
- 284 Maricopa Dr
- 212 Montebello Dr
- 6435 Belton Rd
- 6909 Canyon View Ln
- 784 De Leon Dr
- 309 Rio Verde Dr
- 6201 Sylvania Way
- 6201 Heath Way
- 326 Bright Water Ln
- 644 De Leon Dr
- 160 Silver Shadow Dr Unit E
- 160 Silver Shadow Dr
- 160 Silver Shadow Dr Unit B
- 160 Silver Shadow Dr Unit D
- 160 Silver Shadow Dr Unit 9 D
- 150 - E Silver Shadow Dr Unit 8E
- 150C Silver Shadow Dr
- 150 Silver Shadow Dr Unit E
- 150 Silver Shadow Dr
- 150 Silver Shadow Dr Unit C
- 150 Silver Shadow Dr Unit B
- 150 Silver Shadow Dr Unit A
- 150 Silver Shadow Dr Unit 8-A
- 150 Silver Shadow Dr Unit 8-E
- 170 Silver Shadow Dr #B Dr Unit B
- 101 Western Sage Place
- 101 Western Sage Place Unit A
- 170 Silver Shadow Dr Unit C
- 170 Silver Shadow Dr Unit B
- 170 Silver Shadow Dr Unit A
Your Personal Tour Guide
Ask me questions while you tour the home.