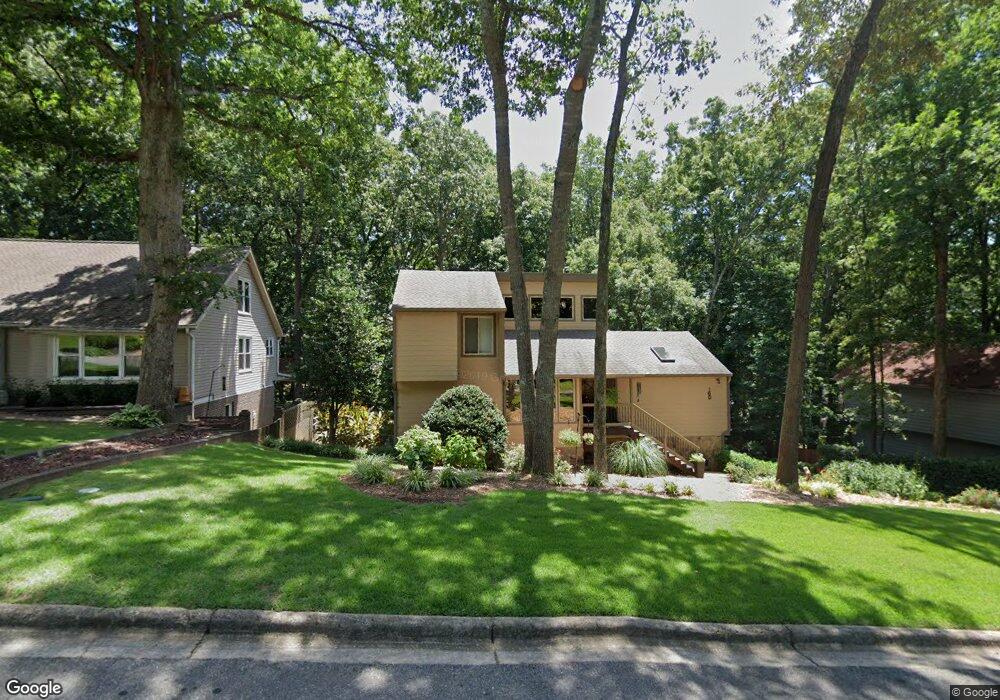
160 Spring Ridge Ct Roswell, GA 30076
Estimated Value: $513,712 - $560,000
3
Beds
2
Baths
1,982
Sq Ft
$271/Sq Ft
Est. Value
About This Home
This home is located at 160 Spring Ridge Ct, Roswell, GA 30076 and is currently estimated at $537,178, approximately $271 per square foot. 160 Spring Ridge Ct is a home located in Fulton County with nearby schools including Northwood Elementary School, Haynes Bridge Middle School, and Centennial High School.
Ownership History
Date
Name
Owned For
Owner Type
Purchase Details
Closed on
May 4, 2007
Sold by
Cole Stephen R and Cole Ellen L
Bought by
Bonselaar David and Bonselaar Jeannette
Current Estimated Value
Home Financials for this Owner
Home Financials are based on the most recent Mortgage that was taken out on this home.
Original Mortgage
$190,425
Outstanding Balance
$115,450
Interest Rate
6.11%
Mortgage Type
New Conventional
Estimated Equity
$421,728
Purchase Details
Closed on
Sep 12, 1994
Sold by
Madden Joseph A Janis
Bought by
Cole Stephen R Ellen L
Home Financials for this Owner
Home Financials are based on the most recent Mortgage that was taken out on this home.
Original Mortgage
$121,626
Interest Rate
8.51%
Mortgage Type
FHA
Create a Home Valuation Report for This Property
The Home Valuation Report is an in-depth analysis detailing your home's value as well as a comparison with similar homes in the area
Home Values in the Area
Average Home Value in this Area
Purchase History
| Date | Buyer | Sale Price | Title Company |
|---|---|---|---|
| Bonselaar David | $253,900 | -- | |
| Cole Stephen R Ellen L | $123,700 | -- |
Source: Public Records
Mortgage History
| Date | Status | Borrower | Loan Amount |
|---|---|---|---|
| Open | Bonselaar David | $190,425 | |
| Previous Owner | Cole Stephen R Ellen L | $121,626 |
Source: Public Records
Tax History
| Year | Tax Paid | Tax Assessment Tax Assessment Total Assessment is a certain percentage of the fair market value that is determined by local assessors to be the total taxable value of land and additions on the property. | Land | Improvement |
|---|---|---|---|---|
| 2025 | $632 | $172,200 | $44,760 | $127,440 |
| 2023 | $5,085 | $180,160 | $45,480 | $134,680 |
| 2022 | $2,500 | $153,520 | $30,880 | $122,640 |
| 2021 | $2,980 | $131,960 | $27,360 | $104,600 |
| 2020 | $3,024 | $132,280 | $24,200 | $108,080 |
| 2019 | $510 | $134,200 | $33,120 | $101,080 |
| 2018 | $2,817 | $121,440 | $22,720 | $98,720 |
| 2017 | $2,446 | $97,240 | $17,360 | $79,880 |
| 2016 | $2,432 | $97,240 | $17,360 | $79,880 |
| 2015 | $2,971 | $97,240 | $17,360 | $79,880 |
| 2014 | $2,509 | $97,240 | $17,360 | $79,880 |
Source: Public Records
Map
Nearby Homes
- 130 Spring Ridge Ct
- 260 Spring Ridge Dr
- 590 Ridgemont Dr
- 705 Springview Ct
- 535 Water Shadow Ln
- 970 Laurel Mill Dr
- 350 S Satinwood Place
- 1120 Northpoint Trace
- 137 Weatherburne Dr
- 650 Wood Work Way
- 1150 Northpoint Trace
- 515 Willow Oak Way
- 455 High Pointe Trail
- 1245 Terramont Dr
- 145 W Ridge Way
- 525 Ansley Dr
- 115 Forest Breeze Cove
- 115 Ansley Ct
- 2618 Long Pointe
- 115 Centennial Trace
- 170 Spring Ridge Ct Unit 1
- 150 Spring Ridge Ct Unit 1
- 46 Overlook Ct
- 245 Spring Ridge Dr
- 180 Spring Ridge Ct
- 140 Spring Ridge Ct
- 195 Spring Ridge Ct Unit 1
- 185 Spring Ridge Ct Unit 1
- 225 Spring Ridge Dr
- 255 Spring Ridge Dr Unit 2
- 175 Spring Ridge Ct
- 205 Spring Ridge Ct Unit 1
- 265 Spring Ridge Dr
- 190 Spring Ridge Ct
- 165 Spring Ridge Ct
- 215 Spring Ridge Dr
- 275 Spring Ridge Dr
- 215 Spring Ridge Ct
- 395 Spring Ridge Dr
- 385 Spring Ridge Dr Unit 5A
Your Personal Tour Guide
Ask me questions while you tour the home.