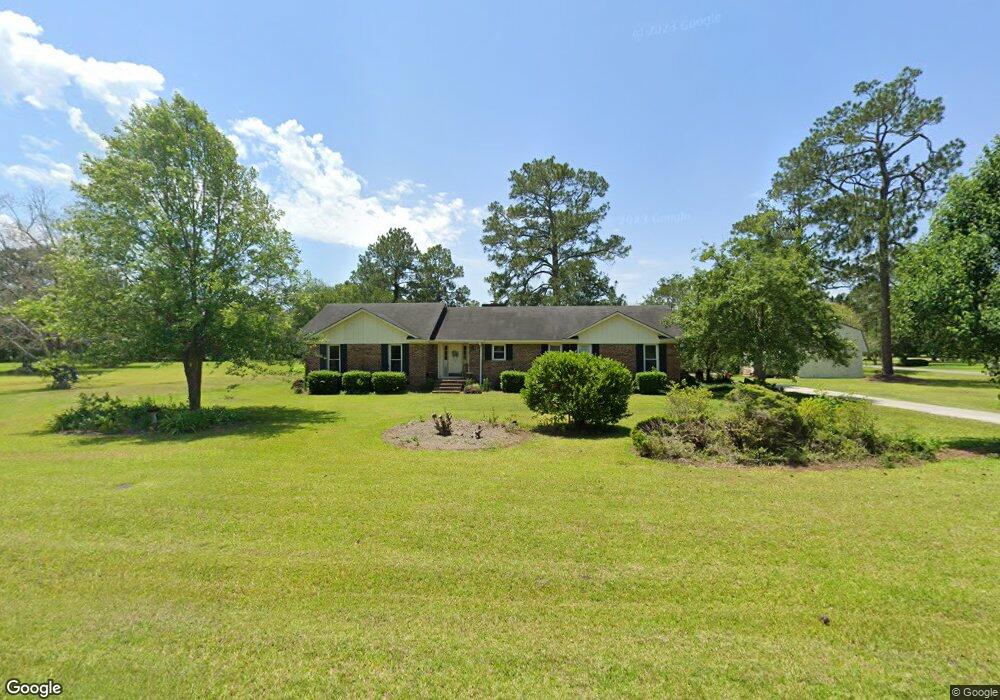
160 Tallokas Cir Moultrie, GA 31788
Estimated Value: $210,633 - $284,000
3
Beds
2
Baths
1,659
Sq Ft
$144/Sq Ft
Est. Value
About This Home
This home is located at 160 Tallokas Cir, Moultrie, GA 31788 and is currently estimated at $239,158, approximately $144 per square foot. 160 Tallokas Cir is a home located in Colquitt County with nearby schools including Sunset Elementary School, Willie J. Williams Middle School, and C.A. Gray Junior High School.
Ownership History
Date
Name
Owned For
Owner Type
Purchase Details
Closed on
Nov 17, 2023
Sold by
Garcia Fabian
Bought by
Mancinas Garcia Fabian and Viera Ramos Lorena
Current Estimated Value
Purchase Details
Closed on
Nov 15, 2023
Sold by
Norris Bishop Investments Inc
Bought by
Garcia Fabian
Purchase Details
Closed on
Sep 20, 2023
Sold by
Mathis Monda
Bought by
Norris Bishop Investments Inc
Purchase Details
Closed on
Jul 30, 2015
Sold by
Holland Jimmie M Life Estate
Bought by
Norris Bishop Enterprises Llc
Home Financials for this Owner
Home Financials are based on the most recent Mortgage that was taken out on this home.
Original Mortgage
$63,750
Interest Rate
4.11%
Mortgage Type
New Conventional
Purchase Details
Closed on
Feb 16, 2009
Sold by
Holland Jimmie M
Bought by
Holland Tammy and Hutto Terri Ann
Purchase Details
Closed on
Jun 21, 2002
Sold by
Synyard William R
Bought by
Holland Jimmie M
Purchase Details
Closed on
May 30, 1985
Bought by
Synyard William R
Create a Home Valuation Report for This Property
The Home Valuation Report is an in-depth analysis detailing your home's value as well as a comparison with similar homes in the area
Home Values in the Area
Average Home Value in this Area
Purchase History
| Date | Buyer | Sale Price | Title Company |
|---|---|---|---|
| Mancinas Garcia Fabian | -- | -- | |
| Garcia Fabian | $128,900 | -- | |
| Norris Bishop Investments Inc | $140,000 | -- | |
| Norris Bishop Enterprises Llc | $70,000 | -- | |
| Holland Tammy | -- | -- | |
| Holland Jimmie M | $125,000 | -- | |
| Synyard William R | $71,000 | -- |
Source: Public Records
Mortgage History
| Date | Status | Borrower | Loan Amount |
|---|---|---|---|
| Previous Owner | Norris Bishop Enterprises Llc | $63,750 |
Source: Public Records
Tax History Compared to Growth
Tax History
| Year | Tax Paid | Tax Assessment Tax Assessment Total Assessment is a certain percentage of the fair market value that is determined by local assessors to be the total taxable value of land and additions on the property. | Land | Improvement |
|---|---|---|---|---|
| 2024 | $1,544 | $76,504 | $10,800 | $65,704 |
| 2023 | $1,544 | $65,284 | $10,800 | $54,484 |
| 2022 | $1,513 | $55,041 | $10,800 | $44,241 |
| 2021 | $1,438 | $52,300 | $10,800 | $41,500 |
| 2020 | $1,438 | $52,300 | $10,800 | $41,500 |
| 2019 | $1,387 | $50,449 | $10,800 | $39,649 |
| 2018 | $1,290 | $50,449 | $10,800 | $39,649 |
| 2017 | $0 | $50,449 | $10,800 | $39,649 |
| 2016 | -- | $50,449 | $10,800 | $39,649 |
| 2015 | $1,581 | $50,449 | $10,800 | $39,649 |
| 2014 | $1,551 | $56,797 | $10,800 | $45,997 |
| 2013 | -- | $56,796 | $10,800 | $45,996 |
Source: Public Records
Map
Nearby Homes
- 125 Inner Cir
- 0 Old Timey Trail
- 7 SE Pheasant Ln
- 0 26th Ave SE
- 424 U S Highway 319
- 240 Cheyenne Way
- 331 Cobblestone Blvd SE
- 12 Creekside Way SE
- 3222 Tallokas Rd
- 3240 Tallokas Rd
- 65 Packer Pride Dr SE
- 204 Nandina Dr
- 5 Marys Ln SE
- 33 Marys Ln
- 30 Marys Ln
- 2016 4th St SE
- 304 Clubview Dr
- 124 Flint Dr
- 1935 4th St SE
- 2021 S Main St
- 103 Dogleg Dr
- 164 Tallokas Cir
- 107 Dogleg Dr
- 105 Dogleg Dr
- 154 Tallokas Cir
- 141 Tallokas Cir
- 145 Tallokas Cir
- 104 Dogleg Dr
- 111 Dogleg Dr
- 137 Tallokas Cir
- 168 Tallokas Cir
- 152 Tallokas Cir
- 113 Inner Cir
- 149 Tallokas Cir
- 148 Tallokas Cir
- 117 Inner Cir
- 109 Dogleg Dr
- 133 Tallokas Cir
- 172 Tallokas Cir
- 19 Terrace Ct