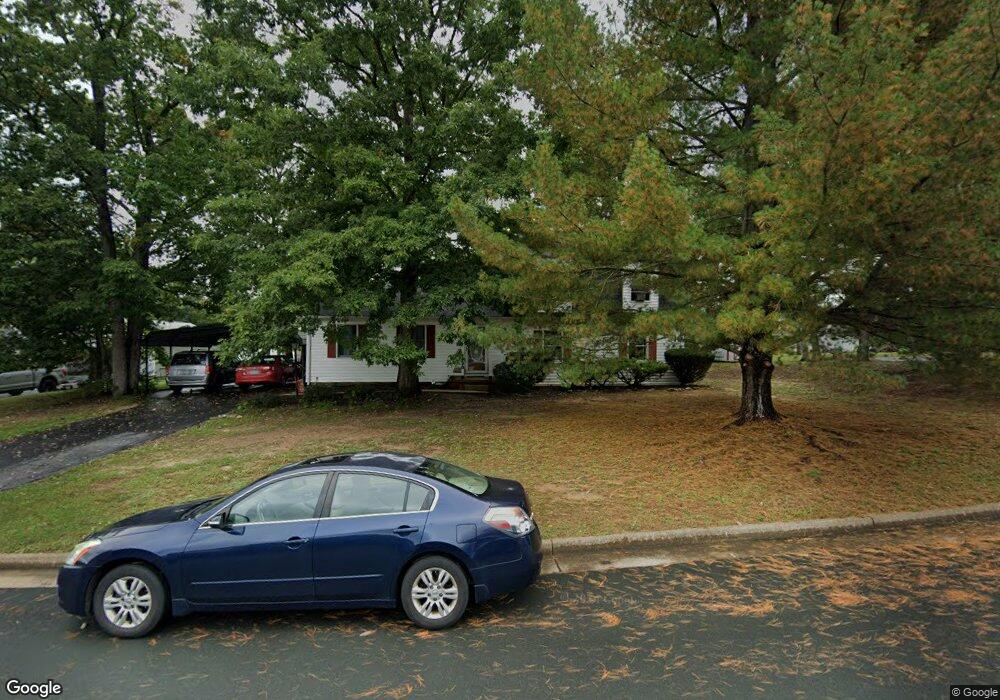
160 Torry Ln Stuarts Draft, VA 24477
Estimated Value: $331,620 - $380,000
3
Beds
2
Baths
2,156
Sq Ft
$166/Sq Ft
Est. Value
About This Home
This home is located at 160 Torry Ln, Stuarts Draft, VA 24477 and is currently estimated at $357,905, approximately $166 per square foot. 160 Torry Ln is a home located in Augusta County with nearby schools including Guy K. Stump Elementary School, Stuarts Draft Middle School, and Stuarts Draft High School.
Ownership History
Date
Name
Owned For
Owner Type
Purchase Details
Closed on
Sep 26, 2025
Sold by
Campbell Kimberly
Bought by
Campbell Kimberly and Campbell James
Current Estimated Value
Home Financials for this Owner
Home Financials are based on the most recent Mortgage that was taken out on this home.
Original Mortgage
$227,564
Outstanding Balance
$227,564
Interest Rate
6.38%
Mortgage Type
FHA
Estimated Equity
$130,341
Purchase Details
Closed on
Mar 25, 2024
Sold by
Shifflett Kimberly A and Campbell Kimberly
Bought by
Campbell Kimberly
Purchase Details
Closed on
Jan 12, 2016
Sold by
Shifflett Edward L and Shifflett Kimberly A
Bought by
Shifflett Kimberly A
Home Financials for this Owner
Home Financials are based on the most recent Mortgage that was taken out on this home.
Original Mortgage
$176,722
Interest Rate
4.5%
Mortgage Type
FHA
Purchase Details
Closed on
Feb 22, 2008
Sold by
Highland Steven C and Lynn Highland C
Bought by
Shifflett Ii Edward L and Shifflett Kimberly A
Home Financials for this Owner
Home Financials are based on the most recent Mortgage that was taken out on this home.
Original Mortgage
$191,987
Interest Rate
5.8%
Mortgage Type
FHA
Create a Home Valuation Report for This Property
The Home Valuation Report is an in-depth analysis detailing your home's value as well as a comparison with similar homes in the area
Purchase History
| Date | Buyer | Sale Price | Title Company |
|---|---|---|---|
| Campbell Kimberly | -- | Old Republic National Title | |
| Campbell Kimberly | -- | First American Title | |
| Campbell Kimberly | -- | First American Title | |
| Shifflett Kimberly A | -- | None Available | |
| Shifflett Ii Edward L | $195,000 | -- |
Source: Public Records
Mortgage History
| Date | Status | Borrower | Loan Amount |
|---|---|---|---|
| Open | Campbell Kimberly | $227,564 | |
| Previous Owner | Shifflett Kimberly A | $176,722 | |
| Previous Owner | Shifflett Ii Edward L | $191,987 |
Source: Public Records
Tax History
| Year | Tax Paid | Tax Assessment Tax Assessment Total Assessment is a certain percentage of the fair market value that is determined by local assessors to be the total taxable value of land and additions on the property. | Land | Improvement |
|---|---|---|---|---|
| 2025 | $1,580 | $303,900 | $60,000 | $243,900 |
| 2024 | $1,600 | $307,600 | $60,000 | $247,600 |
| 2023 | $1,136 | $180,300 | $40,000 | $140,300 |
| 2022 | $1,136 | $180,300 | $40,000 | $140,300 |
| 2021 | $1,136 | $180,300 | $40,000 | $140,300 |
| 2020 | $1,136 | $180,300 | $40,000 | $140,300 |
| 2019 | $1,136 | $180,300 | $40,000 | $140,300 |
| 2018 | $1,149 | $182,366 | $40,000 | $142,366 |
| 2017 | $1,058 | $182,366 | $40,000 | $142,366 |
| 2016 | $1,058 | $182,366 | $40,000 | $142,366 |
| 2015 | $879 | $182,366 | $40,000 | $142,366 |
| 2014 | $879 | $182,366 | $40,000 | $142,366 |
| 2013 | $879 | $183,100 | $55,000 | $128,100 |
Source: Public Records
Map
Nearby Homes
- 294 Forest Springs Dr
- 251 Cooper Dr
- 77 Greenway Rd
- 253 Forest Springs Dr
- 87 Falling Rock Dr
- 165 Cooper Dr
- 124 Forest Springs Dr
- 12 Ceocia Ln
- 501 Howardsville Turnpike
- 38 Greenbriar Ln
- 38 Shady Pond Ln
- 114 Jaspers Ln
- TBD Howardsville Turnpike
- TBD Churchmans Mill Rd
- TBD Gerties Ln
- 0 Kiley Ln Unit 569156
- tbd Mill Creek Ln
- TBD Cold Springs Rd
- 0 Johnson Dr Unit 663189
- 153 Sylvan Dr
Your Personal Tour Guide
Ask me questions while you tour the home.