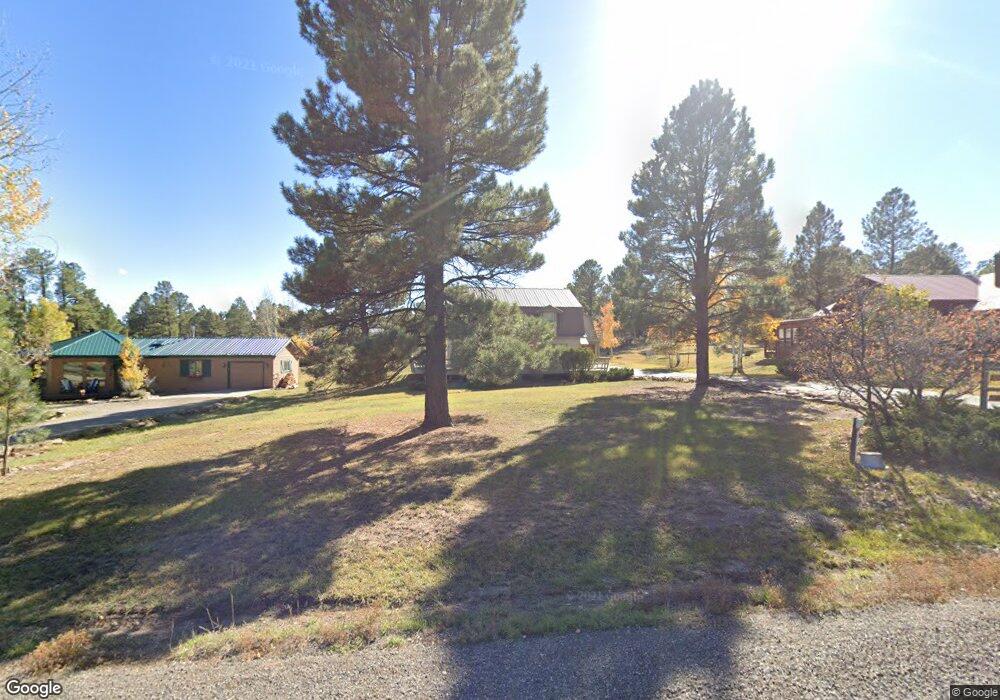
160 Trappers Dr Pagosa Springs, CO 81147
Estimated Value: $712,483 - $816,000
5
Beds
3
Baths
2,368
Sq Ft
$324/Sq Ft
Est. Value
About This Home
This home is located at 160 Trappers Dr, Pagosa Springs, CO 81147 and is currently estimated at $766,371, approximately $323 per square foot. 160 Trappers Dr is a home located in Archuleta County with nearby schools including Pagosa Springs Elementary School, Pagosa Springs Middle School, and Pagosa Springs High School.
Ownership History
Date
Name
Owned For
Owner Type
Purchase Details
Closed on
Jul 8, 2025
Sold by
Digby Marc C and Digby Wanda A
Bought by
Digby Living Trust and Digby
Current Estimated Value
Purchase Details
Closed on
Oct 7, 2008
Sold by
The Cc & Bb Akers Living Trust
Bought by
Digby Marc O and Digby Wanda A
Home Financials for this Owner
Home Financials are based on the most recent Mortgage that was taken out on this home.
Original Mortgage
$198,000
Interest Rate
6%
Mortgage Type
Credit Line Revolving
Purchase Details
Closed on
Jul 15, 1999
Sold by
Berryman Bobbie Akers C and Berryman Bobbie
Bought by
Akers C Clifford & Bobbie B Trustees
Purchase Details
Closed on
Sep 1, 1985
Sold by
Hunter Drew B and Hunter Fred
Bought by
Akers C Clifford C and Akers B
Purchase Details
Closed on
Jan 10, 1976
Sold by
Eic
Bought by
Hunter Drew B and Hunter Fred
Create a Home Valuation Report for This Property
The Home Valuation Report is an in-depth analysis detailing your home's value as well as a comparison with similar homes in the area
Home Values in the Area
Average Home Value in this Area
Purchase History
| Date | Buyer | Sale Price | Title Company |
|---|---|---|---|
| Digby Living Trust | -- | None Listed On Document | |
| Digby Marc O | $258,000 | Great Divide Title | |
| Akers C Clifford & Bobbie B Trustees | -- | -- | |
| Akers C Clifford C | $16,000 | -- | |
| Hunter Drew B | $10,000 | -- |
Source: Public Records
Mortgage History
| Date | Status | Borrower | Loan Amount |
|---|---|---|---|
| Previous Owner | Digby Marc O | $198,000 |
Source: Public Records
Tax History Compared to Growth
Tax History
| Year | Tax Paid | Tax Assessment Tax Assessment Total Assessment is a certain percentage of the fair market value that is determined by local assessors to be the total taxable value of land and additions on the property. | Land | Improvement |
|---|---|---|---|---|
| 2024 | $2,802 | $46,240 | $9,300 | $36,940 |
| 2023 | $2,802 | $46,240 | $9,300 | $36,940 |
| 2022 | $1,560 | $24,000 | $2,780 | $21,220 |
| 2021 | $1,692 | $24,700 | $2,860 | $21,840 |
| 2020 | $1,778 | $25,550 | $3,180 | $22,370 |
| 2019 | $1,754 | $25,550 | $3,180 | $22,370 |
| 2018 | $1,489 | $19,750 | $1,800 | $17,950 |
| 2017 | $1,306 | $19,750 | $1,800 | $17,950 |
| 2016 | $1,191 | $17,790 | $2,410 | $15,380 |
| 2015 | -- | $17,790 | $2,410 | $15,380 |
| 2014 | -- | $18,240 | $3,380 | $14,860 |
Source: Public Records
Map
Nearby Homes
- 166 Stevens Cir
- 57 Martinez Place
- 285 Beaver Cir
- 30 Fawn Ct
- 33 Fawn Ct
- 165 Beaver Cir
- 216 Beaver Cir
- 275 Beaver Cir
- 89 Beaver Cir
- 40 Arrowhead Dr
- 176 Periwinkle Dr
- 279 Canyon Cir
- 308 Canyon Cir
- 246 Periwinkle Dr
- 17 Canyon Cir
- 368 Fireside St
- 136 Highland Ave
- 236 Arrowhead Dr
- 171 Glen Eaton Dr
- 33 Homestead Dr
- 136 Trappers Dr
- 176 Trappers Dr
- 0 Trapper's Dr Unit 660154
- 104 Trappers Dr
- 241 Trappers Dr
- 192 Trappers Dr
- 141 Trappers Dr
- 29 Grant Ct
- 15 Grant Ct
- 201 Trappers Dr
- 80 Trappers Dr
- 299 Stevens Cir
- 125 Trappers Dr
- 0 Grant Ct
- 113 Trappers Dr
- 95 Trappers Dr
- 0 Trappers Dr Unit 769997
- 0 Trappers Dr Unit 756564
- 0 Trappers Dr Unit 751296
- 0 Trappers Dr Unit 744798