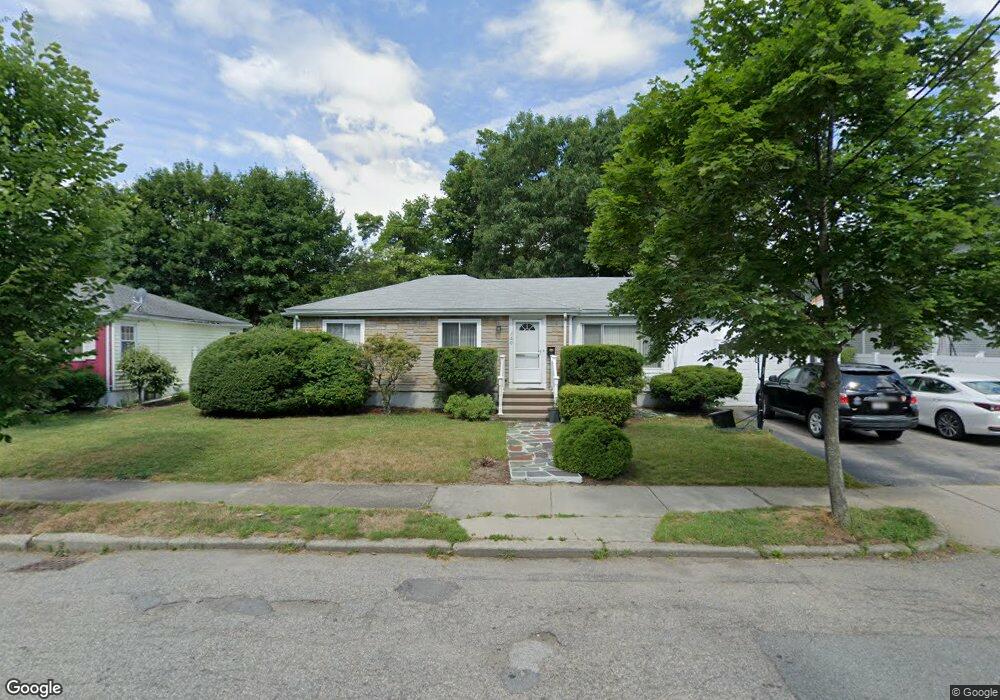
160 Truman Rd Newton Center, MA 02459
Newton Highlands NeighborhoodEstimated Value: $1,121,000 - $1,286,000
4
Beds
2
Baths
1,416
Sq Ft
$858/Sq Ft
Est. Value
About This Home
This home is located at 160 Truman Rd, Newton Center, MA 02459 and is currently estimated at $1,215,556, approximately $858 per square foot. 160 Truman Rd is a home located in Middlesex County with nearby schools including Countryside Elementary School, Charles E Brown Middle School, and Newton South High School.
Ownership History
Date
Name
Owned For
Owner Type
Purchase Details
Closed on
Apr 2, 1997
Sold by
Lelchook Doris E
Bought by
Navarro Jose A and Navarro Marcy A
Current Estimated Value
Home Financials for this Owner
Home Financials are based on the most recent Mortgage that was taken out on this home.
Original Mortgage
$208,000
Interest Rate
7.5%
Mortgage Type
Purchase Money Mortgage
Create a Home Valuation Report for This Property
The Home Valuation Report is an in-depth analysis detailing your home's value as well as a comparison with similar homes in the area
Home Values in the Area
Average Home Value in this Area
Purchase History
| Date | Buyer | Sale Price | Title Company |
|---|---|---|---|
| Navarro Jose A | $260,000 | -- |
Source: Public Records
Mortgage History
| Date | Status | Borrower | Loan Amount |
|---|---|---|---|
| Open | Navarro Jose A | $247,500 | |
| Closed | Navarro Jose A | $213,150 | |
| Closed | Navarro Jose A | $208,000 |
Source: Public Records
Tax History Compared to Growth
Tax History
| Year | Tax Paid | Tax Assessment Tax Assessment Total Assessment is a certain percentage of the fair market value that is determined by local assessors to be the total taxable value of land and additions on the property. | Land | Improvement |
|---|---|---|---|---|
| 2025 | $8,141 | $830,700 | $0 | $0 |
| 2024 | $7,871 | $0 | $0 | $0 |
| 2023 | $7,504 | $737,100 | $663,700 | $73,400 |
| 2022 | $7,180 | $682,500 | $614,500 | $68,000 |
| 2021 | $6,549 | $643,900 | $579,700 | $64,200 |
| 2020 | $6,722 | $643,900 | $579,700 | $64,200 |
| 2019 | $6,532 | $625,100 | $562,800 | $62,300 |
| 2018 | $6,273 | $575,900 | $510,900 | $65,000 |
| 2017 | $6,041 | $543,300 | $482,000 | $61,300 |
| 2016 | $5,779 | $507,800 | $450,500 | $57,300 |
| 2015 | $5,510 | $474,600 | $421,000 | $53,600 |
Source: Public Records
Map
Nearby Homes
- 250 Woodcliff Rd
- 19 Selwyn Rd
- 36 Cannon St
- 45 Brandeis Rd
- 35 Haynes Rd
- 21 Philbrick Rd
- 628 Boylston St
- 125 Oakdale Rd
- 671 Boylston St
- 1308 Walnut St
- 15 Buff Cir
- 625 Boylston St
- 1292 Walnut St
- 42 Sunhill Ln
- 415 Dedham St Unit D
- 58 Country Club Rd
- 116 Upland Ave
- 65 Levbert Rd
- 5 Halcyon Rd
- 85 Dudley Rd