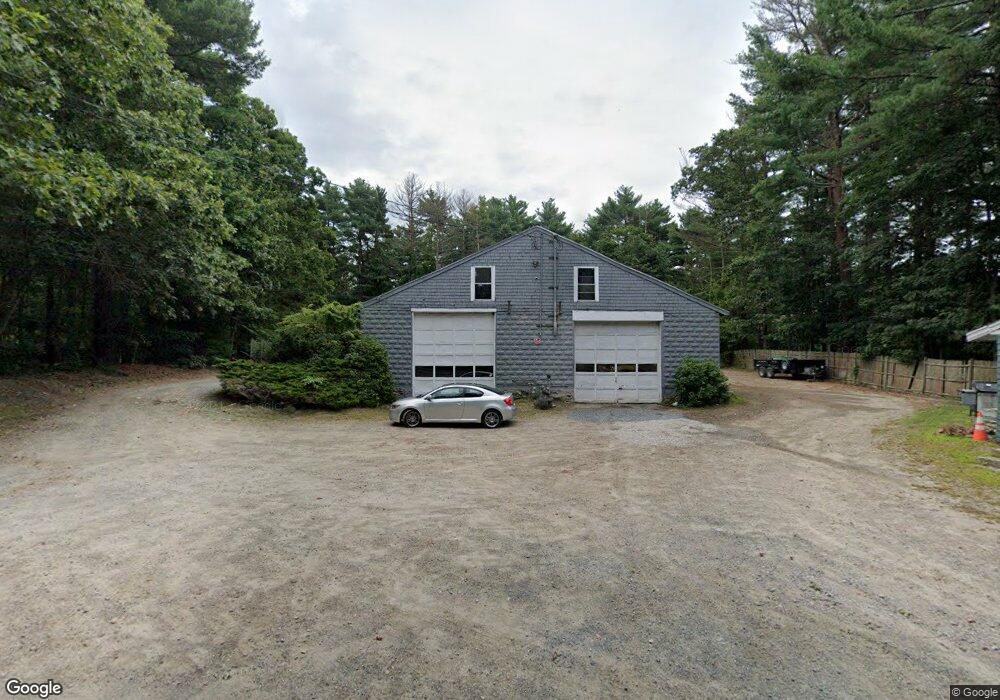
160 Village St Millis, MA 02054
Estimated Value: $798,268
--
Bed
--
Bath
--
Sq Ft
0.98
Acres
About This Home
This home is located at 160 Village St, Millis, MA 02054 and is currently estimated at $798,268. 160 Village St is a home located in Norfolk County with nearby schools including Clyde F Brown, Millis Middle School, and Millis High School.
Ownership History
Date
Name
Owned For
Owner Type
Purchase Details
Closed on
Dec 17, 2015
Sold by
Hope George J
Bought by
Mak Rt
Current Estimated Value
Home Financials for this Owner
Home Financials are based on the most recent Mortgage that was taken out on this home.
Original Mortgage
$312,000
Outstanding Balance
$246,234
Interest Rate
3.89%
Mortgage Type
Commercial
Estimated Equity
$552,034
Purchase Details
Closed on
Aug 31, 1987
Sold by
Sproul Ralph J
Bought by
Hope George J
Home Financials for this Owner
Home Financials are based on the most recent Mortgage that was taken out on this home.
Original Mortgage
$110,000
Interest Rate
10.24%
Mortgage Type
Commercial
Create a Home Valuation Report for This Property
The Home Valuation Report is an in-depth analysis detailing your home's value as well as a comparison with similar homes in the area
Home Values in the Area
Average Home Value in this Area
Purchase History
| Date | Buyer | Sale Price | Title Company |
|---|---|---|---|
| Mak Rt | $420,000 | -- | |
| Hope George J | $140,000 | -- |
Source: Public Records
Mortgage History
| Date | Status | Borrower | Loan Amount |
|---|---|---|---|
| Open | Mak Rt | $312,000 | |
| Closed | Hope George J | $312,000 | |
| Previous Owner | Hope George J | $110,000 |
Source: Public Records
Tax History Compared to Growth
Tax History
| Year | Tax Paid | Tax Assessment Tax Assessment Total Assessment is a certain percentage of the fair market value that is determined by local assessors to be the total taxable value of land and additions on the property. | Land | Improvement |
|---|---|---|---|---|
| 2025 | $5,848 | $356,600 | $161,400 | $195,200 |
| 2024 | $5,855 | $356,600 | $161,400 | $195,200 |
| 2023 | $6,237 | $356,600 | $161,400 | $195,200 |
| 2022 | $6,268 | $332,000 | $163,100 | $168,900 |
| 2021 | $6,514 | $332,000 | $163,100 | $168,900 |
| 2020 | $6,686 | $332,000 | $163,100 | $168,900 |
| 2019 | $5,988 | $320,200 | $151,300 | $168,900 |
| 2018 | $5,770 | $320,200 | $151,300 | $168,900 |
| 2017 | $6,042 | $328,000 | $149,500 | $178,500 |
| 2016 | $5,590 | $320,500 | $149,500 | $171,000 |
| 2015 | $5,449 | $320,500 | $149,500 | $171,000 |
Source: Public Records
Map
Nearby Homes