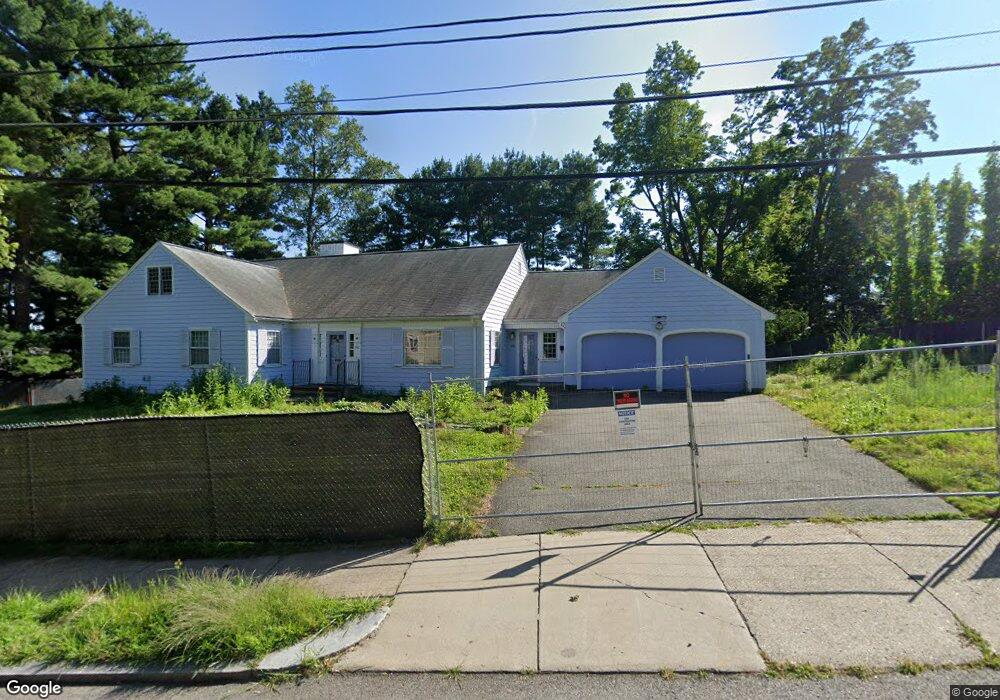
NOT LISTED FOR SALE

Estimated Value: $4,745,808

5 Beds
4 Baths
5,780 Sq Ft
$821/Sq Ft Est. Value

About This Home

This home is located at 160 Windsor Rd, Waban, MA 02468 and is currently priced at $4,745,808, approximately $821 per square foot. 160 Windsor Rd is a home located in Middlesex County with nearby schools including Angier Elementary School, Charles E Brown Middle School, and Newton South High School.

Ownership History

Date Name Owned For Owner Type

Purchase Details

Closed on
Mar 30, 1993
Sold by
Blue Raymond M and Blue Priscilla L
Bought by
Spierings Petrus A M and Wolk Paula C
Current Estimated Value
$4,745,808

Home Financials for this Owner

Home Financials are based on the most recent Mortgage that was taken out on this home.
Original Mortgage
$410,150
Interest Rate
7.73%
Mortgage Type
Purchase Money Mortgage
Source: Public Records
Create a Home Valuation Report for This Property
The Home Valuation Report is an in-depth analysis detailing your home's value as well as a comparison with similar homes in the area

Home Values in the Area

Source: Public Records

Average Home Value in this Area


Source: Public Records

Purchase History

We collect this data history from publicly available records. To have your information removed, we recommend requesting removal directly through your county’s website.

Date Buyer Sale Price Title Company
Spierings Petrus A M $512,688 --
Source: Public Records

Mortgage History

We collect this data history from publicly available records. To have your information removed, we recommend requesting removal directly through your county’s website.

Date Status Borrower Loan Amount
Open Spierings Petrus A M $357,000
Closed Spierings Petrus A M $410,150
Previous Owner Spierings Petrus A M $170,000
Source: Public Records

Tax History

Year Tax Paid Tax Assessment Tax Assessment Total Assessment is a certain percentage of the fair market value that is determined by local assessors to be the total taxable value of land and additions on the property. Land Improvement
2025 $0 $5,109,600 $1,705,100 $3,404,500
2024 $50,847 $4,960,800 $1,655,400 $3,305,400
2023 $50,847 $4,994,800 $1,441,000 $3,553,800
2022 $34,944 $3,321,700 $1,334,300 $1,987,400
2021 $20,310 $1,887,500 $1,887,500 $0
2020 $19,706 $1,887,500 $1,258,800 $628,700
2019 $19,150 $1,832,500 $1,222,100 $610,400
2018 $18,713 $1,729,500 $1,099,000 $630,500
2017 $18,143 $1,631,600 $1,036,800 $594,800
2016 $17,353 $1,524,900 $969,000 $555,900
2015 $16,545 $1,425,100 $905,600 $519,500
Source: Public Records

Map

Your Personal Tour Guide

Ask me questions while you tour the home.