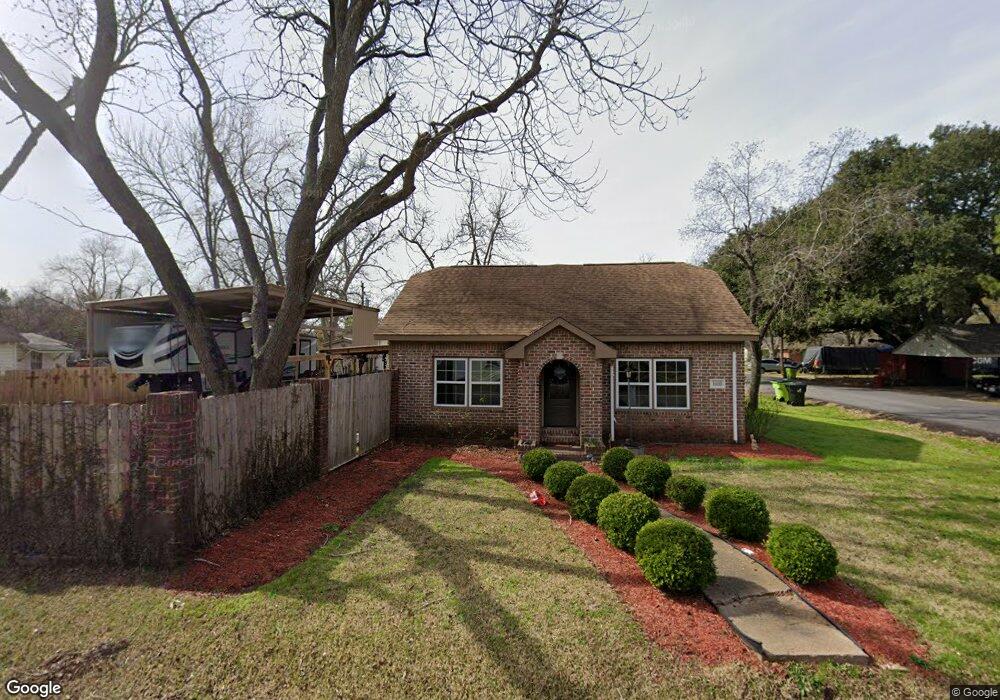
1600 7th St Rosenberg, TX 77471
Estimated Value: $256,835 - $292,000
2
Beds
2
Baths
1,936
Sq Ft
$139/Sq Ft
Est. Value
About This Home
This home is located at 1600 7th St, Rosenberg, TX 77471 and is currently estimated at $269,459, approximately $139 per square foot. 1600 7th St is a home located in Fort Bend County with nearby schools including Taylor Ray Elementary School, George Junior High School, and B.F. Terry High School.
Ownership History
Date
Name
Owned For
Owner Type
Purchase Details
Closed on
Sep 16, 2019
Sold by
Arispe Albert
Bought by
Sanchez Ruben
Current Estimated Value
Purchase Details
Closed on
Jun 9, 2015
Sold by
Shoup Viola Alonzo and Viola Alonzo M
Bought by
Sanchez Ruben and Sanchez Susana
Purchase Details
Closed on
Apr 10, 1992
Sold by
Alonzo Louis and Viola M
Bought by
Sanchez Ruben and Sanchez Susana
Purchase Details
Closed on
Apr 19, 1978
Sold by
Alonzo Louis
Bought by
Sanchez Ruben and Sanchez Susana
Create a Home Valuation Report for This Property
The Home Valuation Report is an in-depth analysis detailing your home's value as well as a comparison with similar homes in the area
Home Values in the Area
Average Home Value in this Area
Purchase History
| Date | Buyer | Sale Price | Title Company |
|---|---|---|---|
| Sanchez Ruben | -- | None Available | |
| Sanchez Ruben | -- | Startex Title Co Llc | |
| Sanchez Ruben | -- | -- | |
| Sanchez Ruben | -- | -- |
Source: Public Records
Tax History
| Year | Tax Paid | Tax Assessment Tax Assessment Total Assessment is a certain percentage of the fair market value that is determined by local assessors to be the total taxable value of land and additions on the property. | Land | Improvement |
|---|---|---|---|---|
| 2025 | $2,748 | $246,128 | $110,488 | $167,253 |
| 2024 | $2,748 | $223,753 | $38,178 | $185,575 |
| 2023 | $2,460 | $256,910 | $86,610 | $170,300 |
| 2022 | $5,067 | $247,370 | $86,610 | $160,760 |
| 2021 | $3,454 | $166,460 | $77,610 | $88,850 |
| 2020 | $3,482 | $164,080 | $76,670 | $87,410 |
| 2019 | $3,017 | $132,080 | $44,860 | $87,220 |
| 2018 | $2,807 | $120,920 | $44,860 | $76,060 |
| 2017 | $2,369 | $101,500 | $44,860 | $56,640 |
| 2016 | $1,957 | $83,850 | $44,860 | $38,990 |
| 2015 | $1,986 | $84,640 | $44,860 | $39,780 |
| 2014 | $1,993 | $83,940 | $44,860 | $39,080 |
Source: Public Records
Map
Nearby Homes
Your Personal Tour Guide
Ask me questions while you tour the home.