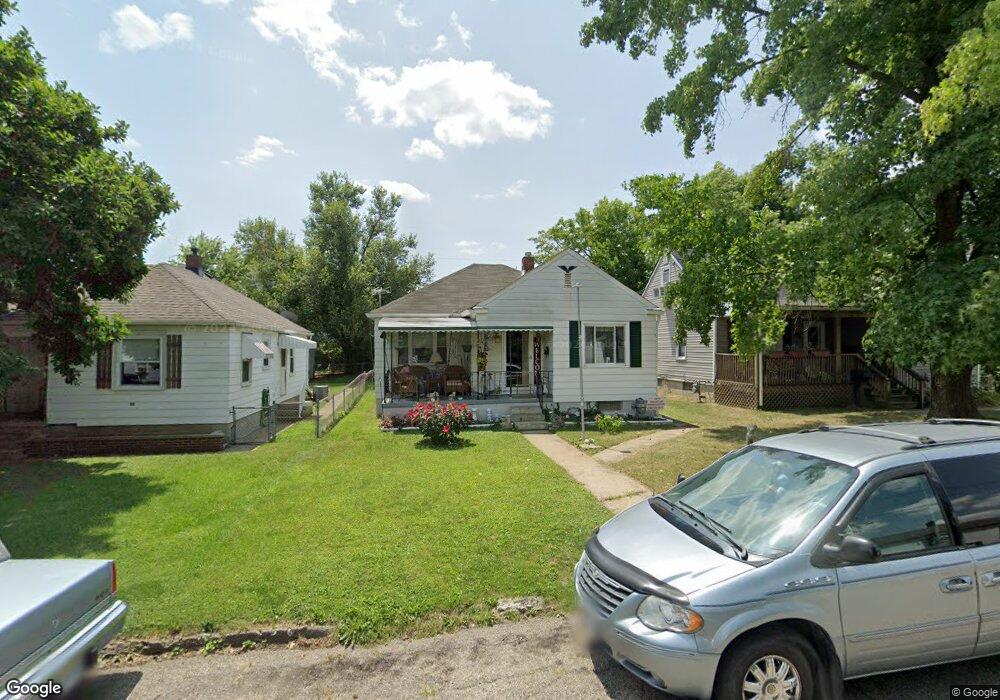
1600 8th Ave Lancaster, OH 43130
Estimated Value: $114,000 - $178,000
3
Beds
2
Baths
982
Sq Ft
$159/Sq Ft
Est. Value
About This Home
This home is located at 1600 8th Ave, Lancaster, OH 43130 and is currently estimated at $156,379, approximately $159 per square foot. 1600 8th Ave is a home located in Fairfield County with nearby schools including General Sherman Junior High School, Lancaster High School, and St Mary Elementary School.
Ownership History
Date
Name
Owned For
Owner Type
Purchase Details
Closed on
Aug 16, 2016
Sold by
Blank James F and Barold E Blank Revocable Trust
Bought by
Snoke Norman E and Snoke Debra J
Current Estimated Value
Home Financials for this Owner
Home Financials are based on the most recent Mortgage that was taken out on this home.
Original Mortgage
$64,800
Outstanding Balance
$51,019
Interest Rate
3.41%
Mortgage Type
Commercial
Estimated Equity
$105,360
Purchase Details
Closed on
Jul 31, 2016
Sold by
Blank James F and Blank Deborah A
Bought by
Harold E Blank Revocable Trust
Home Financials for this Owner
Home Financials are based on the most recent Mortgage that was taken out on this home.
Original Mortgage
$64,800
Outstanding Balance
$51,019
Interest Rate
3.41%
Mortgage Type
Commercial
Estimated Equity
$105,360
Purchase Details
Closed on
Aug 20, 2015
Sold by
Blank Harold E and Blank Harold Edward
Bought by
Blank James F and Harold E Blank Irrevocable Tru
Create a Home Valuation Report for This Property
The Home Valuation Report is an in-depth analysis detailing your home's value as well as a comparison with similar homes in the area
Home Values in the Area
Average Home Value in this Area
Purchase History
| Date | Buyer | Sale Price | Title Company |
|---|---|---|---|
| Snoke Norman E | $72,000 | None Available | |
| Harold E Blank Revocable Trust | -- | None Available | |
| Blank James F | -- | Attorney | |
| Blank Harold E | -- | Attorney |
Source: Public Records
Mortgage History
| Date | Status | Borrower | Loan Amount |
|---|---|---|---|
| Open | Snoke Norman E | $64,800 |
Source: Public Records
Tax History
| Year | Tax Paid | Tax Assessment Tax Assessment Total Assessment is a certain percentage of the fair market value that is determined by local assessors to be the total taxable value of land and additions on the property. | Land | Improvement |
|---|---|---|---|---|
| 2025 | $3,251 | $48,050 | $9,280 | $38,770 |
| 2024 | $3,251 | $36,160 | $5,570 | $30,590 |
| 2023 | $1,019 | $36,160 | $5,570 | $30,590 |
| 2022 | $1,033 | $36,160 | $5,570 | $30,590 |
| 2021 | $741 | $26,950 | $5,570 | $21,380 |
| 2020 | $712 | $26,950 | $5,570 | $21,380 |
| 2019 | $678 | $26,950 | $5,570 | $21,380 |
| 2018 | $475 | $21,950 | $5,570 | $16,380 |
| 2017 | $475 | $21,170 | $5,570 | $15,600 |
| 2016 | $802 | $21,170 | $5,570 | $15,600 |
| 2015 | $469 | $21,250 | $5,570 | $15,680 |
| 2014 | $447 | $21,250 | $5,570 | $15,680 |
| 2013 | $447 | $21,250 | $5,570 | $15,680 |
Source: Public Records
Map
Nearby Homes
- 1616 W Fair Ave
- 539 N Ohio Ave
- 1829 Beacon St
- 461 N Shoshone Dr
- 701 Washington Ave
- 1125 Zimmer St
- 215 Summitview Dr
- 844 Washington Ave
- 507 Washington Ave
- 1829 Shoshone Dr
- 1511 Cedar Hill Rd
- 302 Washington Ave
- 132 N Pierce Ave
- 1000 Goodwin Ave
- 1414 Cedar Hill Rd
- 757 W Mulberry St
- 114-116 S Cedar Ave
- 32 2nd St
- 82 W 5th St
- 81 W 5th St
Your Personal Tour Guide
Ask me questions while you tour the home.