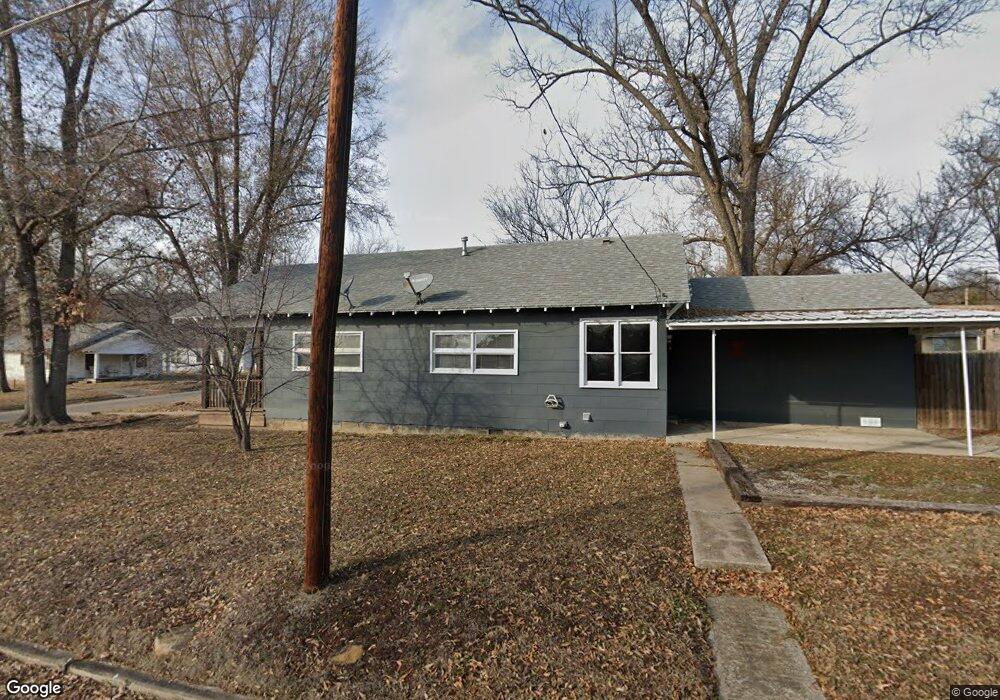
1600 Bigchief Ave Pawhuska, OK 74056
Estimated Value: $90,000 - $132,000
2
Beds
1
Bath
1,068
Sq Ft
$106/Sq Ft
Est. Value
About This Home
This home is located at 1600 Bigchief Ave, Pawhuska, OK 74056 and is currently estimated at $112,695, approximately $105 per square foot. 1600 Bigchief Ave is a home located in Osage County with nearby schools including Indian Camp Elementary School, Pawhuska Elementary School, and Pawhuska Middle School.
Ownership History
Date
Name
Owned For
Owner Type
Purchase Details
Closed on
Dec 4, 2020
Sold by
Sell Elizabeth Ann
Bought by
Christenson Rebecca Ann
Current Estimated Value
Home Financials for this Owner
Home Financials are based on the most recent Mortgage that was taken out on this home.
Original Mortgage
$58,400
Outstanding Balance
$42,392
Interest Rate
2.7%
Mortgage Type
New Conventional
Estimated Equity
$70,303
Purchase Details
Closed on
Mar 29, 2018
Sold by
Burns Rikki L and Burns Chris L
Bought by
Sell Elizabeth A
Purchase Details
Closed on
Mar 7, 2018
Sold by
Easley Michael A
Bought by
Burns Rikki L and Burns Chris L
Purchase Details
Closed on
Jun 1, 2001
Sold by
Todd Betty Diane
Bought by
Easley Michael A
Purchase Details
Closed on
May 24, 2000
Sold by
Moore Betty Jean
Bought by
Moore Betty Jean Life Est
Purchase Details
Closed on
Jul 20, 1995
Sold by
Poulter Mildred Dolores Etal
Bought by
Moore Betty Jean Etal
Create a Home Valuation Report for This Property
The Home Valuation Report is an in-depth analysis detailing your home's value as well as a comparison with similar homes in the area
Home Values in the Area
Average Home Value in this Area
Purchase History
| Date | Buyer | Sale Price | Title Company |
|---|---|---|---|
| Christenson Rebecca Ann | $73,000 | Firstitle & Abstract Svc Llc | |
| Sell Elizabeth A | $42,000 | -- | |
| Burns Rikki L | -- | -- | |
| Easley Michael A | $29,000 | -- | |
| Moore Betty Jean Life Est | -- | -- | |
| Moore Betty Jean Etal | $20,000 | -- |
Source: Public Records
Mortgage History
| Date | Status | Borrower | Loan Amount |
|---|---|---|---|
| Open | Christenson Rebecca Ann | $58,400 |
Source: Public Records
Tax History Compared to Growth
Tax History
| Year | Tax Paid | Tax Assessment Tax Assessment Total Assessment is a certain percentage of the fair market value that is determined by local assessors to be the total taxable value of land and additions on the property. | Land | Improvement |
|---|---|---|---|---|
| 2024 | $808 | $9,756 | $504 | $9,252 |
| 2023 | $808 | $9,658 | $504 | $9,154 |
| 2022 | $731 | $8,760 | $504 | $8,256 |
| 2021 | $784 | $8,760 | $504 | $8,256 |
| 2020 | $461 | $5,055 | $504 | $4,551 |
| 2019 | $454 | $5,055 | $504 | $4,551 |
| 2018 | $361 | $5,055 | $504 | $4,551 |
| 2017 | $364 | $5,049 | $504 | $4,545 |
| 2016 | $236 | $2,617 | $504 | $2,113 |
| 2015 | $244 | $2,617 | $504 | $2,113 |
| 2014 | $240 | $2,520 | $504 | $2,016 |
| 2013 | $228 | $2,400 | $504 | $1,896 |
Source: Public Records
Map
Nearby Homes
- 501 W 17th St
- 1721 Bighill Ave
- 1715 Grandview Ave
- 1700 Grandview Ave
- 1815 Grandview Ave
- 1419 Leahy Ave
- 101 E 11th St
- 208 E 12th St
- 0 Prudom Ave
- 312 E 11th St
- 321 E 10th St
- 421 E 11th St
- 906 Rogers Ave
- 225 E 6th St
- 320 E 7th St
- 2019 Mckenzie Rd
- 1205 Brenner Ave
- 2125 Mckenzie Rd
- 1322 Boundary Ave
- 1318 Boundary Ave
- 1608 Bigchief Ave
- 1522 Bigchief Ave
- 1612 Bigchief Ave
- 1607 Bigchief Ave
- 1601 Claremore Ave
- 1518 Bigchief Ave
- 1609 Claremore Ave
- 1611 Claremore Ave
- 1523 Bigchief Ave
- 420 W 17th St
- 1514 Bigchief Ave
- 1611 Bigchief Ave
- 410 W 17th St
- 1510 Bigchief Ave
- 1515 Claremore Ave
- 515 W 16th St
- 1500 Bigchief Ave
- 417 W 17th St
- 505 W 15th St
- 1610 Claremore Ave