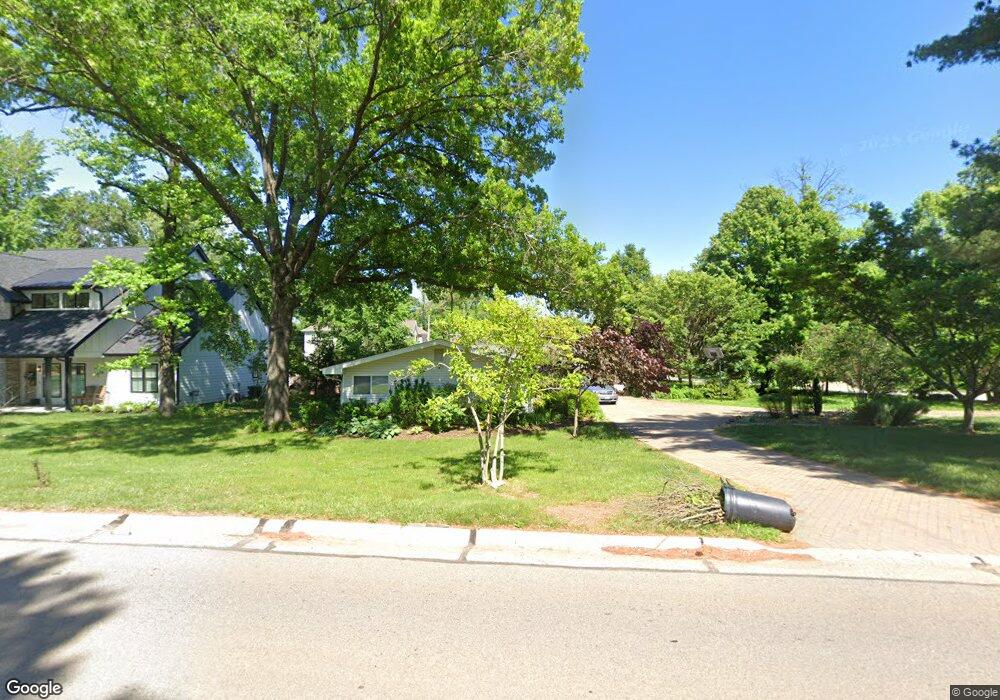
1600 Bopp Rd Saint Louis, MO 63131
Estimated Value: $631,000 - $841,000
4
Beds
2
Baths
2,635
Sq Ft
$274/Sq Ft
Est. Value
About This Home
This home is located at 1600 Bopp Rd, Saint Louis, MO 63131 and is currently estimated at $723,291, approximately $274 per square foot. 1600 Bopp Rd is a home located in St. Louis County with nearby schools including Westchester Elementary School, North Kirkwood Middle School, and Kirkwood Senior High School.
Ownership History
Date
Name
Owned For
Owner Type
Purchase Details
Closed on
Jul 3, 2018
Sold by
Allen David Chandler
Bought by
Central Trust Co and John Fingal Allen Iii Trust
Current Estimated Value
Purchase Details
Closed on
Sep 10, 2004
Sold by
Bohac Allen Yvonne M
Bought by
Allen Jack F
Purchase Details
Closed on
Sep 9, 2004
Sold by
Dare Jeffrey R and Dare Shary M
Bought by
Allen Jack F
Purchase Details
Closed on
Dec 21, 2001
Sold by
Thornburg Phillip and Thornburg Leslie E
Bought by
Dare Jeffrey R and Dare Shary M
Home Financials for this Owner
Home Financials are based on the most recent Mortgage that was taken out on this home.
Original Mortgage
$161,000
Interest Rate
6.41%
Purchase Details
Closed on
Jun 3, 1997
Sold by
Dale Dewinter and Dale Susan
Bought by
Dare Jeffrey R and Dare Shary M
Home Financials for this Owner
Home Financials are based on the most recent Mortgage that was taken out on this home.
Original Mortgage
$134,900
Interest Rate
8.1%
Create a Home Valuation Report for This Property
The Home Valuation Report is an in-depth analysis detailing your home's value as well as a comparison with similar homes in the area
Home Values in the Area
Average Home Value in this Area
Purchase History
| Date | Buyer | Sale Price | Title Company |
|---|---|---|---|
| Central Trust Co | -- | None Available | |
| Allen Jack F | -- | -- | |
| Allen Jack F | $310,000 | -- | |
| Dare Jeffrey R | $190,000 | -- | |
| Dare Jeffrey R | -- | -- |
Source: Public Records
Mortgage History
| Date | Status | Borrower | Loan Amount |
|---|---|---|---|
| Previous Owner | Dare Jeffrey R | $161,000 | |
| Previous Owner | Dare Jeffrey R | $134,900 |
Source: Public Records
Tax History Compared to Growth
Tax History
| Year | Tax Paid | Tax Assessment Tax Assessment Total Assessment is a certain percentage of the fair market value that is determined by local assessors to be the total taxable value of land and additions on the property. | Land | Improvement |
|---|---|---|---|---|
| 2025 | $6,012 | $108,280 | $71,570 | $36,710 |
| 2024 | $6,012 | $103,910 | $58,350 | $45,560 |
| 2023 | $5,919 | $103,910 | $58,350 | $45,560 |
| 2022 | $5,577 | $91,240 | $58,350 | $32,890 |
| 2021 | $5,517 | $91,240 | $58,350 | $32,890 |
| 2020 | $3,714 | $58,910 | $53,870 | $5,040 |
| 2019 | $3,719 | $58,910 | $53,870 | $5,040 |
| 2018 | $3,278 | $46,550 | $26,660 | $19,890 |
| 2017 | $3,287 | $46,550 | $26,660 | $19,890 |
| 2016 | $3,245 | $46,550 | $23,050 | $23,500 |
| 2015 | $3,449 | $49,440 | $23,050 | $26,390 |
| 2014 | $3,370 | $47,200 | $12,200 | $35,000 |
Source: Public Records
Map
Nearby Homes
- 8 Briarbrook Trail
- 1728 Folkstone Dr
- 723 Oak Valley Dr
- 1126 Bopp Rd
- 1741 Pine Hill Dr
- 1090 Kinstern Dr
- 12439 Springdale Ln Unit TBB
- 1345 Woodgate Dr
- 1029 Kinstern Dr
- The Hawthorne Plan at Ballas Ridge
- The Roclare II Plan at Ballas Ridge
- The Westchester IV Plan at Ballas Ridge
- The Nottingham II Plan at Ballas Ridge
- The Hawthorne II Plan at Ballas Ridge
- TBB
- TBB Ballas Ridge Roclare II
- TBB Ballas Ridge Hawthorne II
- TBB Ballas Ridge Westchester IV
- TBB
- 811 Cherry St
- 1614NC Bopp Rd
- 1614 Bopp Rd
- 11970 Claychester Dr
- 11962 Claychester Dr
- 1622 Bopp Rd
- 11959 Claychester Dr
- 11952 Claychester Dr
- 11949 Claychester Dr
- 11944 Claychester Dr
- 12 Claychester Dr
- 1631 Bopp Rd
- 2 Briarbrook Trail
- 11941 Claychester Dr
- 11936 Claychester Dr
- 4 Briarbrook Trail
- 1711 Bopp Rd
- 11933 Claychester Dr
- 11928 Claychester Dr
- 6 Briarbrook Trail
- 1725 Bopp Rd