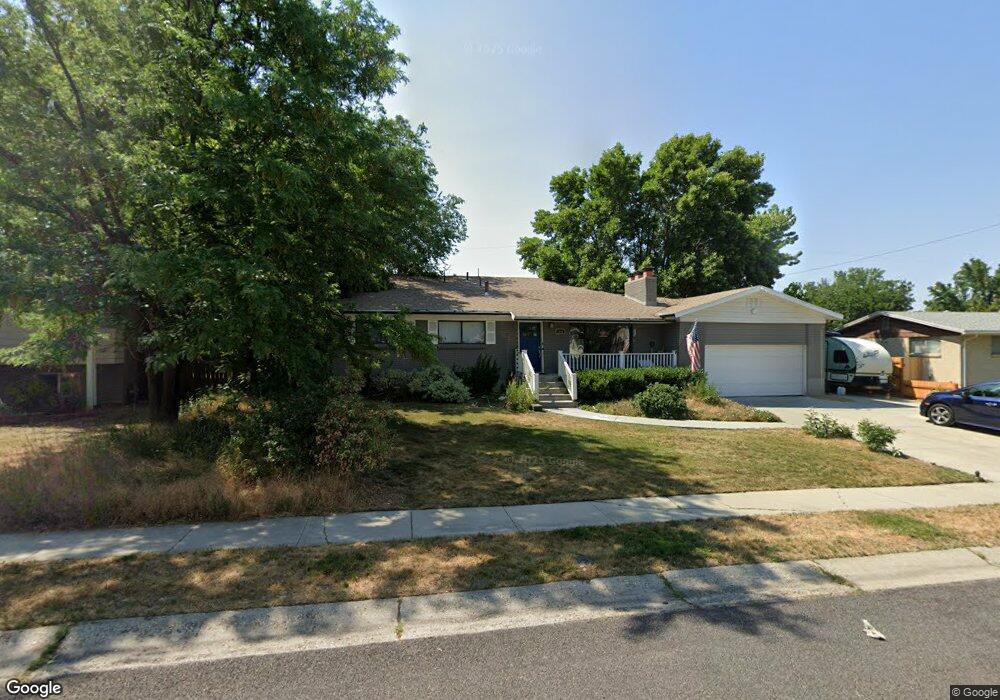
1600 E Kings Row Dr Salt Lake City, UT 84117
Estimated Value: $855,792 - $897,000
5
Beds
3
Baths
3,394
Sq Ft
$257/Sq Ft
Est. Value
About This Home
This home is located at 1600 E Kings Row Dr, Salt Lake City, UT 84117 and is currently estimated at $871,698, approximately $256 per square foot. 1600 E Kings Row Dr is a home located in Salt Lake County with nearby schools including Oakwood Elementary School, Bonneville Junior High School, and Cottonwood High School.
Ownership History
Date
Name
Owned For
Owner Type
Purchase Details
Closed on
Jun 29, 2015
Sold by
Ohana Marketing Inc
Bought by
Smith Kathryn T and Smith Christopher N
Current Estimated Value
Home Financials for this Owner
Home Financials are based on the most recent Mortgage that was taken out on this home.
Original Mortgage
$401,300
Outstanding Balance
$312,582
Interest Rate
3.83%
Mortgage Type
New Conventional
Estimated Equity
$559,116
Purchase Details
Closed on
Sep 30, 2014
Sold by
Crk Investments Llc
Bought by
Ohana Marketing Inc
Purchase Details
Closed on
Sep 29, 2014
Sold by
Casper Maureen Marie and Diedrich Maureen Marie
Bought by
Crk Investments Llc
Purchase Details
Closed on
Sep 9, 2014
Sold by
Casper Maureen Marie
Bought by
Crk Investments Llc
Purchase Details
Closed on
Dec 7, 1994
Sold by
Diedrich Charles J and Therese Diedrich M
Bought by
Diedrich Charles J and Therese Diedrich M
Create a Home Valuation Report for This Property
The Home Valuation Report is an in-depth analysis detailing your home's value as well as a comparison with similar homes in the area
Home Values in the Area
Average Home Value in this Area
Purchase History
| Date | Buyer | Sale Price | Title Company |
|---|---|---|---|
| Smith Kathryn T | -- | Highland Title Agency | |
| Ohana Marketing Inc | -- | Gt Title Services Slc | |
| Crk Investments Llc | -- | Landmark Title | |
| Crk Investments Llc | -- | Landmark Title | |
| Diedrich Charles J | -- | -- |
Source: Public Records
Mortgage History
| Date | Status | Borrower | Loan Amount |
|---|---|---|---|
| Open | Smith Kathryn T | $401,300 |
Source: Public Records
Tax History Compared to Growth
Tax History
| Year | Tax Paid | Tax Assessment Tax Assessment Total Assessment is a certain percentage of the fair market value that is determined by local assessors to be the total taxable value of land and additions on the property. | Land | Improvement |
|---|---|---|---|---|
| 2025 | $4,384 | $846,200 | $282,200 | $564,000 |
| 2024 | $4,384 | $793,500 | $273,500 | $520,000 |
| 2023 | $4,311 | $760,400 | $214,100 | $546,300 |
| 2022 | $4,146 | $734,900 | $209,900 | $525,000 |
| 2021 | $3,916 | $602,900 | $185,300 | $417,600 |
| 2020 | $3,608 | $550,700 | $181,200 | $369,500 |
| 2019 | $3,606 | $536,000 | $171,000 | $365,000 |
| 2018 | $3,427 | $492,800 | $171,000 | $321,800 |
| 2017 | $3,135 | $475,900 | $171,000 | $304,900 |
| 2016 | $2,848 | $434,700 | $171,000 | $263,700 |
| 2015 | $2,907 | $414,000 | $173,400 | $240,600 |
| 2014 | -- | $222,500 | $178,800 | $43,700 |
Source: Public Records
Map
Nearby Homes
- 1578 E 4945 S
- 1617 Meadowmoor Rd
- 4972 Boabab Cir
- 1697 E Woodbridge Dr Unit 4
- 4878 S Highland Cir Unit 6
- 4856 S Colony Cir
- 1489 Spring Ln
- 4828 Brooks Way
- 1365 E Foxmont Ln
- 4785 S Dipo Place Unit C
- 4852 S Highland Cir Unit 6
- 1342 E Saxony Place
- 1309 Hidden Creek Ct
- 1319 E Foxmont Ln
- 5058 S Moray Ct
- 1574 E 5215 S
- 1304 E Weyburn Ln Unit 10
- 4686 San Lucas Ct Unit 342
- 4988 Timber Way Unit 310
- 5079 S El Amador St
- 1600 Kings Row Dr
- 1610 Kings Row Dr
- 1610 E Kings Row Dr
- 1590 Kings Row Dr
- 1599 Delaware Ln
- 1599 E Delaware Ln
- 1609 Delaware Ln
- 1589 Delaware Ln
- 4910 S 1625 E
- 4897 Damon Cir
- 1617 Delaware Ln
- 1617 E Delaware Ln
- 1578 Kings Row Dr
- 1585 Kings Row Dr
- 1577 E Delaware Ln
- 1577 Delaware Ln
- 1617 E Kings Row Dr
- 1617 Kings Row Dr
- 4928 S 1645 E
- 1598 Delaware Ln